. 2011 Jun;43(6):554-60.
doi: 10.1038/ng.821. Epub 2011 May 1.

General properties of transcriptional time series in Escherichia coli

Affiliations

General properties of transcriptional time series in Escherichia coli

Lok-Hang So et al. Nat Genet. 2011 Jun.

Abstract

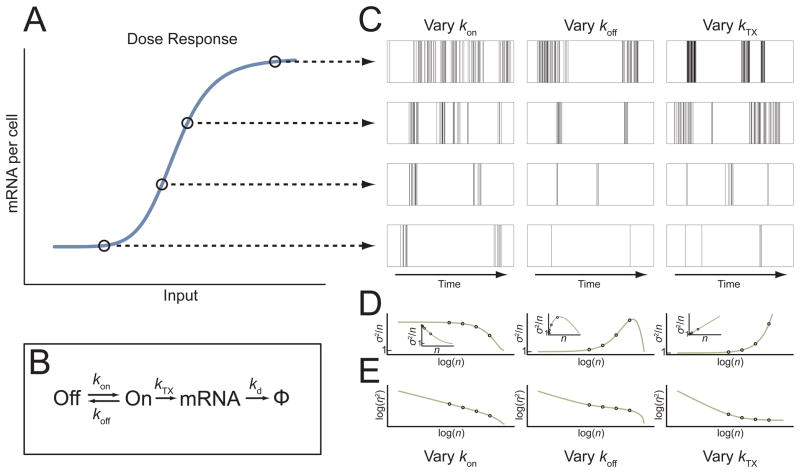
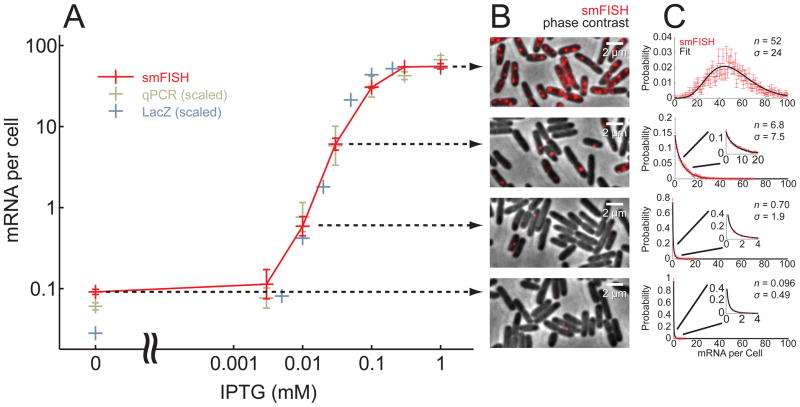
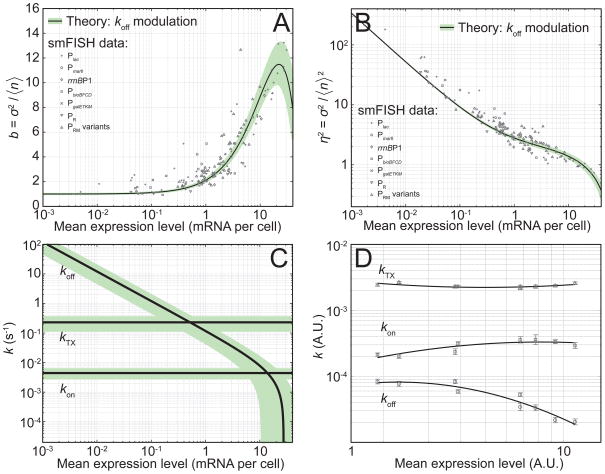
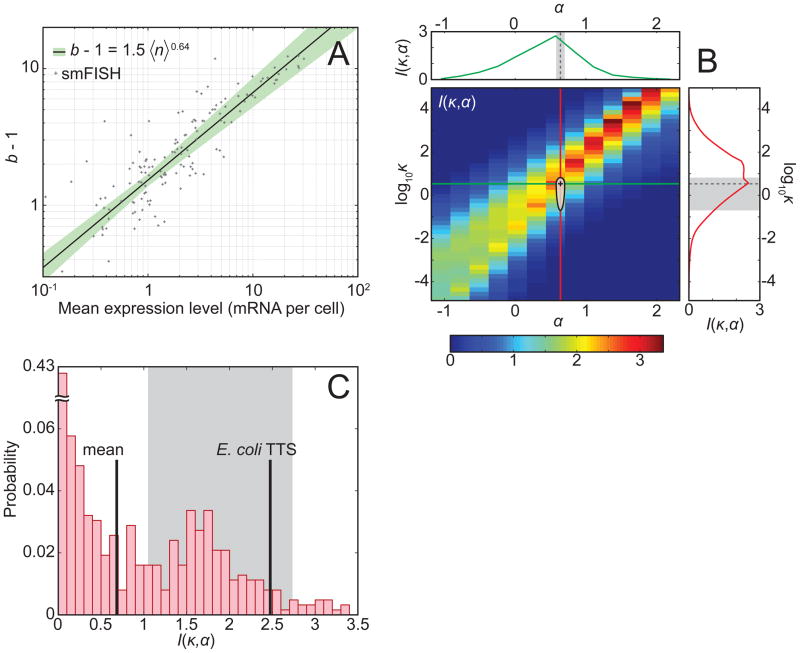
Gene activity is described by the time series of discrete, stochastic mRNA production events. This transcriptional time series shows intermittent, bursty behavior. One consequence of this temporal intricacy is that gene expression can be tuned by varying different features of the time series. Here we quantify copy-number statistics of mRNA from 20 Escherichia coli promoters using single-molecule fluorescence in situ hybridization in order to characterize the general properties of these transcriptional time series. We find that the degree of burstiness is correlated with gene expression level but is largely independent of other parameters of gene regulation. The observed behavior can be explained by the underlying variation in the duration of bursting events. Using Shannon's mutual information function, we estimate the mutual information transmitted between an outside stimulus, such as the extracellular concentration of inducer molecules, and intracellular levels of mRNA. This suggests that the outside stimulus transmits information reflected in the properties of transcriptional time series.


Figures

Figure 1
Figure 1. Different features of the transcriptional time-series can be modulated to vary gene expression level
(A) Schematic representation of the gene-activity curve for a typical bacterial promoter. The expression level (mean number of mRNAs per cell, 〈n〉) as a function of the external stimulus is shown. The curve is arbitrary, but is typical of the sigmoidal response exhibited by many bacterial promoters ,, for example see FIGURE 2A below. (B) The kinetic parameters governing mRNA production and annihilation in the two-state model. (C) Different modulation schemes of the transcriptional time-series, all capable of creating the gene activity curve in panel (A). Each plot shows the time-series of mRNA production events (bars). Data was created by simulating the two-state model using the Gillespie method . In each of the three cases shown, only a single parameter of gene activity was varied (kon, left; koff, middle; kTX, right). All time-series in the same row produce the same mean mRNA level 〈n〉. (D) The effect of the different modulation schemes on the observed mRNA copy-number statistics. The burstiness b = σ2/〈n〉 is plotted as a function of the mean mRNA number 〈n〉. The main panel shows b(〈n〉) on a semilog scale, while the insets show the same data on a linear scale. b(〈n〉) was calculated analytically for the two-state model . (E) The noiseη2 = σ2/〈n2 as a function of the mean mRNA number 〈n〉. η2(〈n〉) was calculated analytically for the two-state model.
Figure 2
Figure 2. Single-molecule FISH used to characterize mRNA copy-number statistics
(A) Gene expression level (mRNA/cell) from the Plac promoter, as a function of inducer (isopropyl β-D-1-thiogalactopyranoside, IPTG) concentration. The mean mRNA number per cell as measured by single-molecule FISH (smFISH, average of 2 independent experiments) is shown, as well as the results of quantitative PCR (qPCR, average of 2 independent experiments; normalized by the mean smFISH level) and β-galactosidase activity assay, as reported in the literature (, normalized by the mean smFISH level). Error bars denote standard errors from duplicate experiments. The good agreement between the three assays, over ~3 orders of expression level, demonstrates the accuracy and dynamic range of the smFISH method. (B) Typical images of smFISH-labeled cells at different induction levels. An overlay of the phase contrast (grayscale) and smFISH probes targeting the lacZ gene (red) is shown. Each image corresponds to the expression level designated by the horizontal arrow. (C) lacZ mRNA copy-number histograms obtained from smFISH at different induction levels. The experimental data (red) and the fit to a negative binomial distribution (black) are shown, as well as the estimated values for mean mRNA number 〈n〉 and standard deviation σ in that sample. Each plot corresponds to the expression level designated by the horizontal arrow.
Figure 3
Figure 3. Gene expression level in E. coli is varied by changing the gene off-rate
(A) The burstiness b as a function of the mean expression level 〈n〉. Markers, smFISH data. Solid line, theoretical prediction for the case of varying only koff. The theoretical curve is obtained by solving analytically the expression for b(〈n〉) and then using kon and kTX as fitting parameters. Shaded green area designates the 95% confidence interval of the fit. (B) The noise η2 as a function of the mean expression level 〈n〉. Notations as in panel (A). The theoretical parameters (kon, kTX) extracted from fitting b(〈n〉) in panel (A) were used to plot the theoretical curve. (C) The estimated rate parameters for gene activity in E. coli. These were obtained from fitting b(〈n〉) in panel (A) to the case of varying koff in the two-state model. The errors in kon and kTX (green shade) are based on the variability in estimates between individual promoters (FIGURE S11). The error in koff (green shade) is calculated from the resulting fit. (D) Direct measurement of the two-state rate parameters in individual living cells. mRNA production from the promoter Plac/ara was quantified using the MS2-GFP method . Data (markers) is from 9 independent experiments (>400 cells). Error bars represent standard errors within each experiment. Solid lines are fits to second degree polynomials.
Figure 4
Figure 4. The transcriptional time-series optimizes information representation by the cell
(A) The plot shows b−1 = σ2/〈n〉−1 as a function of the mean expression level 〈n〉. Markers designate experimental data (same data set as in FIGURE 3A above). Solid line, fit to a power law σ2/〈n〉−1= 〈nα/κ. The power law yields a good fit (R2 = 0.76) in the range 〈n〉 ≈ 0.3–40, and allows an estimation of the parameters κ and α. (B) The calculated mutual information I between outside stimulus and the transcriptional time-series (scaled to represent the protein species) is plotted for a typical bacterial promoter. A power-law behavior of b(〈n〉) is assumed, b−1= 〈nα/κ, and I is plotted as a function of the parameters κ and α. As seen from the plots to the right and above, the values of κ and α corresponding to the experimental data lie very close to the “ridge” in I(κ,α). The shaded region around the experimental data point (+) represents the error estimate based the multiple sources: κ and α estimation from the fit in panel (A); the number of protein molecules produced from each mRNA ,; mRNA lifetime ; and cell doubling time. (C) The histogram of mutual information (I) values is plotted, for the different (κ,α) combinations examined in panel (B). The E. coli transcriptional time-series exhibits a mutual information value (I α 2.5) that is much higher than the average performance by all possible modulation schemes (I = 0.68). The shaded area corresponds to the experimental error estimate for κ and α, as in Panel (B).

Comment in

Similar articles

Cited by

References

    1. Golding I, Cox EC. Eukaryotic transcription: what does it mean for a gene to be ‘on’? Curr Biol. 2006;16:R371–373. - PubMed
    1. Golding I, Paulsson J, Zawilski SM, Cox EC. Real-time kinetics of gene activity in individual bacteria. Cell. 2005;123:1025–1036. - PubMed
    1. Raj A, van Oudenaarden A. Nature, nurture, or chance: stochastic gene expression and its consequences. Cell. 2008;135:216–226. doi: 10.1016/j.cell.2008.09.050. S0092-8674(08)01243-9 [pii] - DOI - PMC - PubMed
    1. Chubb JR, Liverpool TB. Bursts and pulses: insights from single cell studies into transcriptional mechanisms. Curr Opin Genet Dev. 2010;20:478–484. doi: 10.1016/j.gde.2010.06.009. S0959-437X(10)00116-4 [pii] - DOI - PubMed
    1. Chubb JR, Trcek T, Shenoy SM, Singer RH. Transcriptional pulsing of a developmental gene. Curr Biol. 2006;16:1018–1025. doi: 10.1016/j.cub.2006.03.092. S0960-9822(06)01426-6 [pii] - DOI - PMC - PubMed

Publication types