. 2011 Jun;12(6):544-50.
doi: 10.1038/ni.2034. Epub 2011 May 1.

Transcription factor Foxp1 exerts essential cell-intrinsic regulation of the quiescence of naive T cells

Affiliations

Transcription factor Foxp1 exerts essential cell-intrinsic regulation of the quiescence of naive T cells

Xiaoming Feng et al. Nat Immunol. 2011 Jun.

Abstract

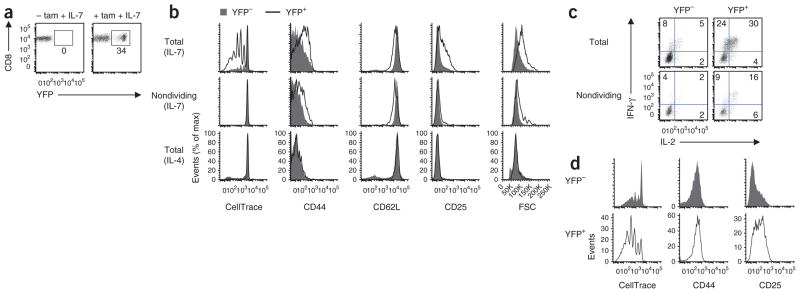
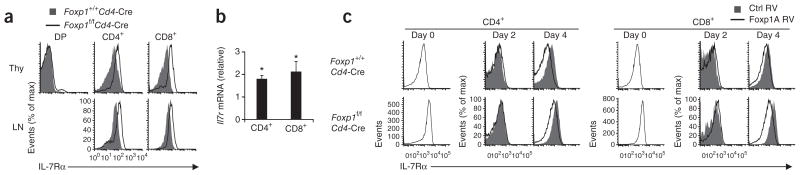
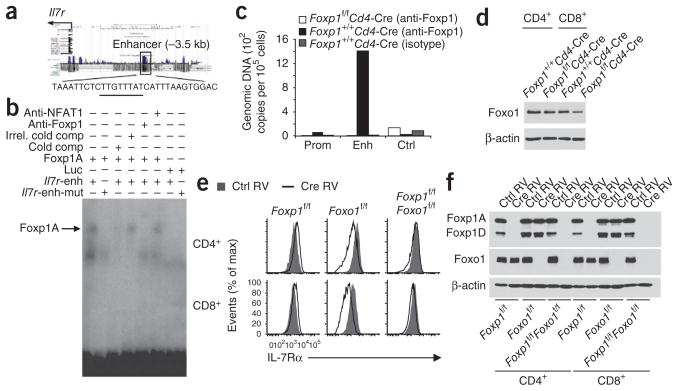
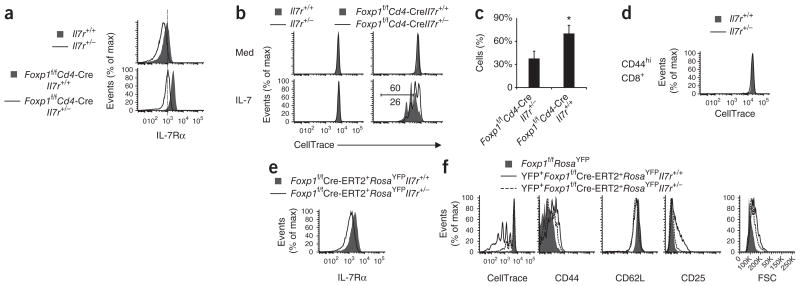
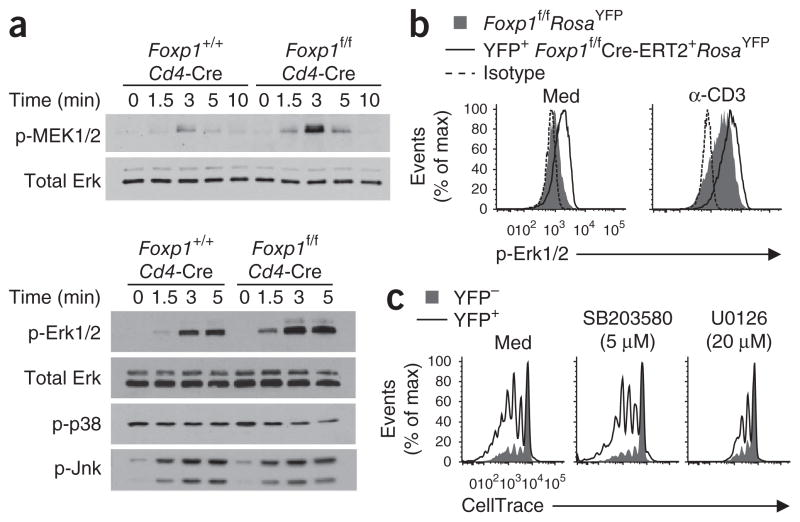
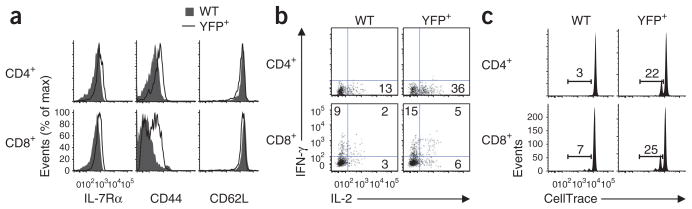
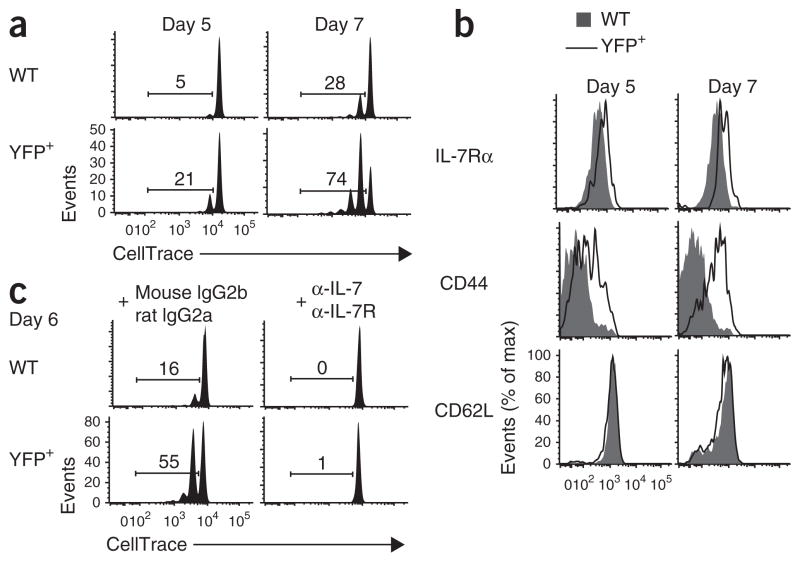
The molecular mechanisms that underlie T cell quiescence are poorly understood. Here we report that mature naive CD8(+) T cells lacking the transcription factor Foxp1 gained effector phenotype and function and proliferated directly in response to interleukin 7 (IL-7) in vitro. Foxp1 repressed expression of the IL-7 receptor α-chain (IL-7Rα) by antagonizing Foxo1 and negatively regulated signaling by the kinases MEK and Erk. Acute deletion of Foxp1 induced naive T cells to gain an effector phenotype and proliferate in lympho-replete mice. Foxp1-deficient naive CD8(+) T cells proliferated even in lymphopenic mice deficient in major histocompatibility complex class I. Our results demonstrate that Foxp1 exerts essential cell-intrinsic regulation of naive T cell quiescence, providing direct evidence that lymphocyte quiescence is achieved through actively maintained mechanisms that include transcriptional regulation.


Conflict of interest statement

COMPETING FINANCIAL INTERESTS

The authors declare no competing financial interests.

Figures

Figure 1
Figure 1
Foxp1-deficient mature naive CD8+ T cells gain effector phenotype and function and proliferate in response to IL-7 in vitro. (a) Induction of YFP expression in sorted CD44loCD8+ Foxp1f/fCre- ERT2+RosaYFP T cells cultured for 6 d with IL-7 in the presence (+ tam + IL-7) or absence (- tam + IL-7) of tamoxifen. Numbers adjacent to outlined areas indicate percent YFP+ cells. (b) Cell proliferation and phenotype characterization of sorted CD44loCD8+ Foxp1f/fCre-ERT2+RosaYFP T cells cultured for 6 d with tamoxifen plus either IL-7 or IL-4; far left, analysis of cell division on the basis of CellTrace dilution. (c) Cytokine production in cells treated with tamoxifen and IL-7 as in b and then stimulated for 4 h with PMA plus ionomycin (cell division assessed by CellTrace dilution). Numbers in quadrants indicate percent cells in each throughout. (d) Cell proliferation and phenotype characterization of sorted CD44hiCD8+ Foxp1f/fCre-ERT2+RosaYFP T cells cultured for 6 d with tamoxifen and IL-7; far left, analysis of cell division on the basis of CellTrace dilution. Data are representative of at least two independent experiments.
Figure 2
Figure 2
Foxp1 represses IL-7Rα expression in T cells. (a) Cell surface IL-7Rα expression in thymocytes (Thy) and peripheral lymph node T cells (LN) from Foxp1+/+Cd4-Cre control mice and Foxp1f/fCd4-Cre mice. (b) Real-time PCR analysis of Il7r mRNA in peripheral CD4+ and CD8+ T cells from Foxp1f/fCd4-Cre mice; results are normalized to Rpl32 mRNA (which encodes the ribosomal protein L32) and are presented relative to Il7r mRNA in Foxp1+/+Cd4-Cre control cells. *P < 0.01 (Student’s t-test). (c) Cell surface IL-7Rα expression on Foxp1+/+Cd4-Cre and Foxp1f/fCd4-Cre peripheral T cells before (day 0) and after (day 2 and day 4) overexpression in vitro of control retrovirus encoding GFP alone (Ctrl RV) or retrovirus encoding GFP and Foxp1A (Foxp1A RV). Data are representative of three independent experiments (a,c) or are from three independent experiments (b; average and s.d.).
Figure 3
Figure 3
Foxp1 represses Il7r expression by binding to its enhancer, and the downregulation of IL-7Rα expression in Foxo1-deficient T cells is Foxp1 dependent. (a) Predicted forkhead-binding site (underlined) in the known Il7r enhancer, located 3.5 kilobases upstream of the transcription start site (−3.5 kb). (b) EMSA of in vitro–translated Foxp1A with the Il7r enhancer fragment DNA as probe. Anti-NFAT1, control antibody to the transcription factor NFAT1; Irrel. cold comp, irrelevant unlabeled competitor; Cold comp, unlabeled competitor; Luc, control luciferase protein; Il7r-enh, Il7r enhancer oligonucleotide; Il7r-enh-mut, mutated Il7r enhancer oligonucleotide. (c) ChIP analysis of the promoter (Prom), enhancer (Enh) and control regions of the Il7r locus in Foxp1+/+Cd4-Cre and Foxp1f/fCd4-Cre CD8+ T cells, assessed with anti-Foxp1 or isotype-matched control antibody; results are presented as genomic DNA copies relative to standard input DNA dilution. (d) Immunoblot analysis of Foxo1 expression in Foxp1 Cd4-Cre and Foxp1 Cd4-Cre T cells ex vivo; β-actin serves as a loading control throughout. (e) Cell surface IL-7Rα expression in vitro on CD4+ or CD8+ Foxp1f/f, Foxo1f/f and Foxp1f/fFoxo1f/f T cells infected with retrovirus expressing GFP alone (Ctrl RV) or Cre and GFP (Cre RV) and then cultured for 4 d; results are gated on GFP+ (retrovirus-expressing) cells. (f) Immunoblot analysis of the expression of Foxp1 and Foxo1 in sorted GFP+ cells 4 d after retroviral infection as in e. Data are representative of at least two independent experiments.
Figure 4
Figure 4
Foxp1-deficient CD8+ T cells with higher expression of IL-7Rα proliferate more in response to IL-7. (a) Cell surface IL-7Rα expression on CD8+ T cells (ex vivo) from Il7r+/+ and Il7r+/− mice (top) and Foxp1f/fCd4-Cre Il7r+/+ and Foxp1f/fCd4-Cre Il7r+/− mice (bottom). (b) Proliferation of CD8+ T cells (genotypes as in a) in response to medium (Med) or IL-7 in vitro, assessed at day 3. Numbers above (Foxp1f/f Cd4-Cre Il7r+/+) and below (Foxp1f/fCd4-Cre Il7r+/−) bracketed line indicate percent cells with more than two divisions. (c) Frequency of the CD8+ Foxp1f/fCd4-Cre Il7r+/+ and Foxp1f/fCd4-Cre Il7r+/− T cells with more than two divisions in response to IL-7 in vitro, assessed at day 3. *P < 0.05 (Student’s t-test). (d) Proliferation of sorted Il7r+/+and Il7r+/− CD44hi CD8+ T cells in response to IL-7 in vitro, assessed at day 6. (e) Cell surface IL-7Rα expression in CD8+ T cells (ex vivo) from Foxp1f/fCre-ERT2+RosaYFPIl7r+/+ and Foxp1f/fCre-ERT2+RosaYFPIl7r+/− mice. (f) Proliferation and phenotype characterization of CD44loCD8+ T cells sorted from Foxp1f/fCre-ERT2+ RosaYFPIl7r+/+ mice, Foxp1f/fCre-ERT2+RosaYFPIl7r+/− mice and Foxp1f/fRosaYFP mice and cultured for 6 d with tamoxifen and IL-7. Data are representative of at least two independent experiments (a,b,df) or are from three independent experiments (c; average and s.d.).
Figure 5
Figure 5
MEK-Erk activation is enhanced in Foxp1-deficient T cells, and blocking MEK activation inhibits the proliferation of Foxp1-deficient naive CD8+ T cells in response to IL-7 in vitro. (a) Immunoblot analysis of phosphorylated (p-) MEK1 and MEK2 (MEK1/2), Erk1 and Erk2 (Erk1/2), p38 and Jnk in CD5lo DP thymocytes sorted from Foxp1+/+Cd4-Cre or Foxp1f/fCd4-Cre mice and then stimulated by crosslinking with anti-CD3 and anti-CD28; total Erk serves as a loading control. (b) Intracellular staining of phosphorylated Erk in CD44loCD8+ T cells sorted from Foxp1f/f Cre-ERT2+RosaYFP or Foxp1f/fRosaYFP mice and cultured with tamoxifen and IL-7 for 4 d before (Med) and after stimulation by crosslinking with anti-CD3 (α-CD3). Isotype, staining with isotype-matched control antibody. (c) Proliferation of CD44loCD8+ T cells sorted from Foxp1f/fCre-ERT2+RosaYFP mice and cultured for 6 d with tamoxifen and IL-7 in the presence of the medium alone (Med) or the chemical inhibitors SB203580 (p38 inhibitor) and U0126 (MEK1-MEK2 inhibitor). The inhibitor concentrations used here were the highest that still allowed 90% of the viability in control cultures without inhibitors (data not shown). Data are representative of at least two independent experiments.
Figure 6
Figure 6
Foxp1-deficient mature naive T cells gain effector phenotype and function and proliferate in intact recipient mice. (a) Phenotype characterization of Foxp1f/fCre-ERT2+RosaYFP (YFP+) and CD45.1+ control wild-type (WT) donor T cells 8 d after transfer into intact recipient mice. (b) Intracellular staining of the production of IL-2 and IFN-γ in donor T cells as in a after stimulation for 4 h with PMA plus ionomycin. Numbers in quadrants indicate percent cells in each. (c) Proliferation of donor T cells as in a 15 d after transfer into intact recipient mice. Numbers above bracketed lines indicate percent proliferating cells. Data are representative of two independent experiments.
Figure 7
Figure 7
Foxp1-deficient naive CD8+ T cells proliferate in sublethally irradiated mice deficient in H2-Kb and H2-Db. (a) Proliferation of YFP+ Foxp1f/fCre-ERT2+RosaYFP and CD45.1+ wild-type control donor CD8+ T cells 5 d and 7 d after transfer into sublethally irradiated recipient mice deficient in H2-Kb and H2-Db. (b) Phenotype characterization of donor CD8+ T cells as in a. (c) Proliferation of donor CD8+ T cells as in a 6 d after transfer into sublethally irradiated recipient mice deficient in H2-Kb and H2-Db treated with monoclonal anti-IL-7 plus monoclonal anti-IL-7Rα (α-IL-7 + α-IL-7R) or with the control antibodies mouse immunoglobulin G2b and rat immunoglobulin G2a (mouse IgG2b + rat IgG2a). Numbers above bracketed lines (a,c) indicate percent proliferating cells. Data are representative of at least two independent experiments.

Comment in

Similar articles

Cited by

References

    1. Yusuf I, Fruman DA. Regulation of quiescence in lymphocytes. Trends Immunol. 2003;24:380–386. - PubMed
    1. Tzachanis D, Lafuente EM, Li L, Boussiotis VA. Intrinsic and extrinsic regulation of T lymphocyte quiescence. Leuk Lymphoma. 2004;45:1959–1967. - PubMed
    1. Ernst B, Lee DS, Chang JM, Sprent J, Surh CD. The peptide ligands mediating positive selection in the thymus control T cell survival and homeostatic proliferation in the periphery. Immunity. 1999;11:173–181. - PubMed
    1. Kieper WC, Jameson SC. Homeostatic expansion and phenotypic conversion of naive T cells in response to self peptide/MHC ligands. Proc Natl Acad Sci USA. 1999;96:13306–13311. - PMC - PubMed
    1. Cho BK, Rao VP, Ge Q, Eisen HN, Chen J. Homeostasis-stimulated proliferation drives naive T cells to differentiate directly into memory T cells. J Exp Med. 2000;192:549–556. - PMC - PubMed

Publication types

MeSH terms