. 2011 May;17(5):604-9.
doi: 10.1038/nm.2365. Epub 2011 May 1.

A role for interleukin-2 trans-presentation in dendritic cell-mediated T cell activation in humans, as revealed by daclizumab therapy

Affiliations

A role for interleukin-2 trans-presentation in dendritic cell-mediated T cell activation in humans, as revealed by daclizumab therapy

Simone C Wuest et al. Nat Med. 2011 May.

Abstract

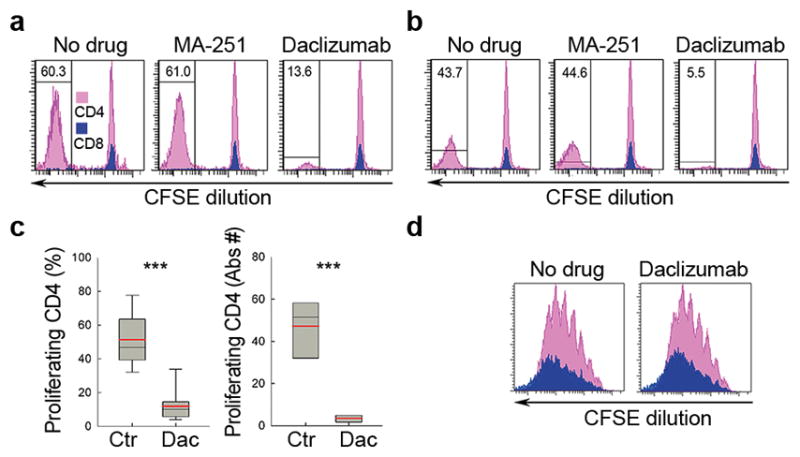
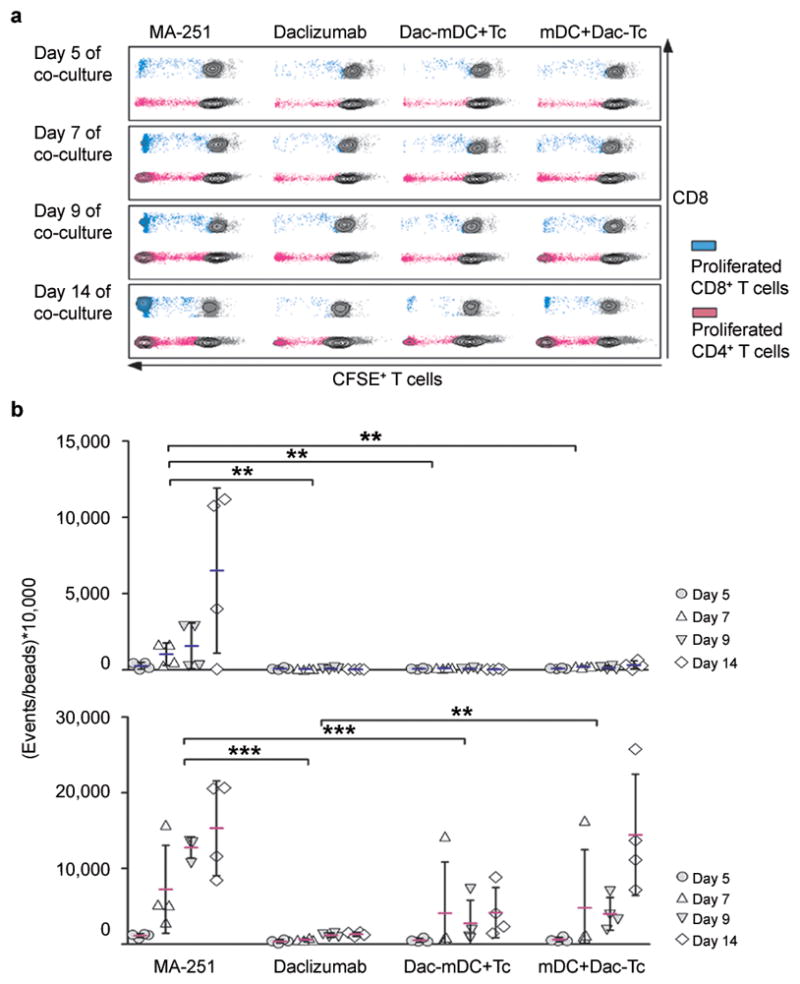
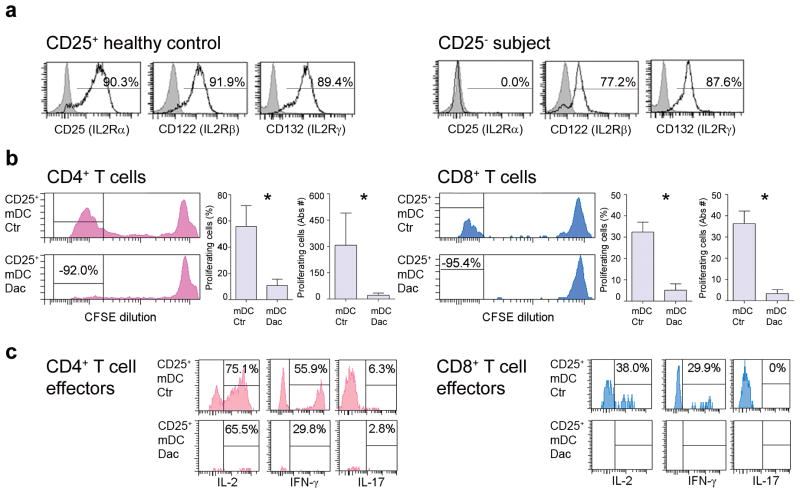
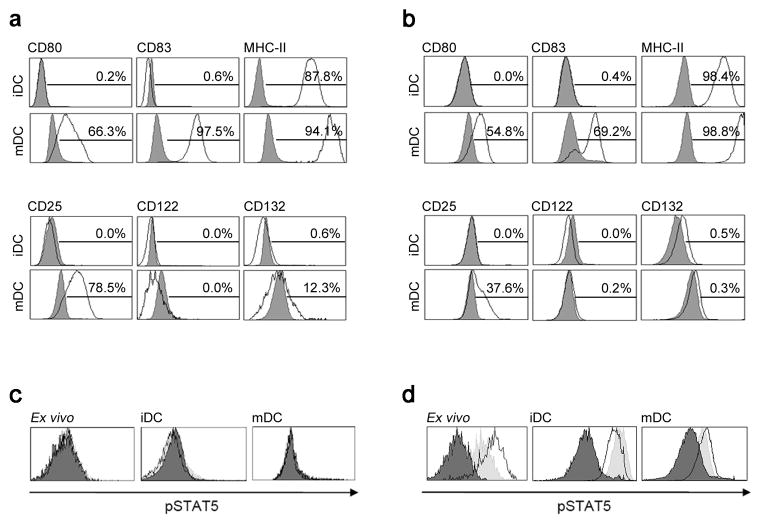
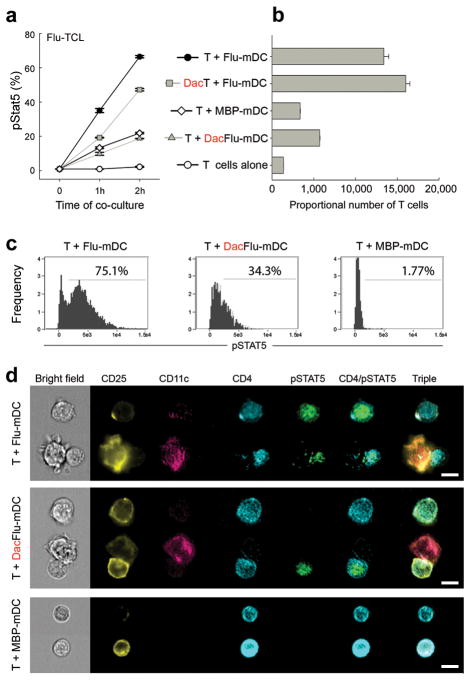
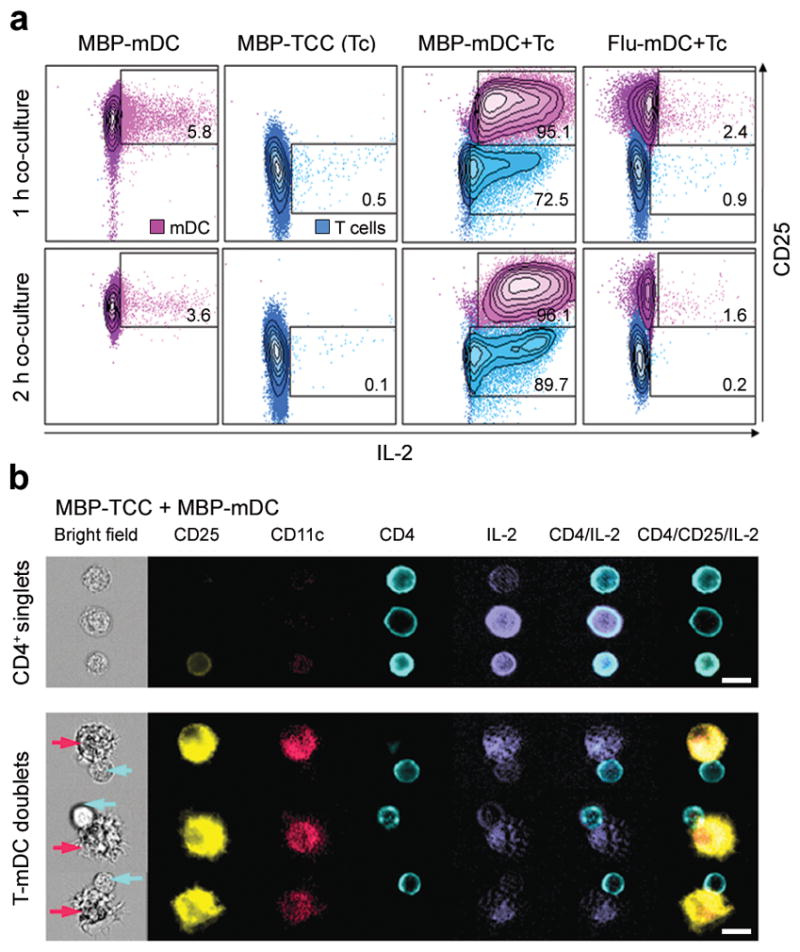
Although previous studies have described CD25 expression and production of interleukin-2 (IL-2) by mature dendritic cells (mDCs), it remains unclear how these molecules participate in the activation of T cells. In search of the mechanisms by which daclizumab, a humanized monoclonal antibody against CD25, inhibits brain inflammation in multiple sclerosis, we observed that although the drug has limited effects on polyclonal T cell activation, it potently inhibits activation of antigen-specific T cells by mDCs. We show that mDCs (and antigen-experienced T cells) secrete IL-2 toward the mDC-T cell interface in an antigen-specific manner, and mDCs 'lend' their CD25 to primed T cells in trans to facilitate early high-affinity IL-2 signaling, which is crucial for subsequent T cell expansion and development of antigen-specific effectors. Our data reveal a previously unknown mechanism for the IL-2 receptor system in DC-mediated activation of T cells.


Conflict of interest statement

Competing Financial Interests

B.B. and T.A.W. are co-inventors on NIH patents related to the use of daclizumab in MS and as such have received patent royalty payments.

Figures

Figure 1
Figure 1. Ag-specific T cell proliferation in DC-T cell co-cultures is profoundly inhibited by daclizumab
(a) CFSE (Carboxyfluorescein diacetate succinimidyl diester) proliferation assay: mDCs loaded with FluHA (0.5μg ml−1) or (b) human brain protein (HBP; 10μg ml−1) were co-cultured with autologous CFSE-stained T cells in the presence or absence of CD25 blocking-Ab control MA-251 (10μg ml−1), or daclizumab (Dac; 10μg ml−1). After 7–10 days, T cell proliferation was assessed by CFSE dilution assay after gating on CD4+ (pink) and CD8+ T cells (blue). Data are representative of five independent experiments. (c) Box plots represent group data on Ag-specific CD4+ T cell proliferation with marked group medians (black horizontal line) and means (red horizontal line). ***P < 0.001. Mean values are shown ± SD. (d) CFSE proliferation assay after polyclonal T cell activation with CD3/CD28 Dynabeads (0.3 : 1 bead to T cell ratio) in the presence or absence of daclizumab. Proliferation was measured by CFSE dilution after 5 d using the same gating strategy (i.e. CD4+ T cells in pink, CD8+ T cells in blue).
Figure 2
Figure 2. Selective blockade of CD25 on mDCs is sufficient to abrogate T cell proliferation
(a) CFSE stained T cells and mDCs were co-cultured in the presence of 20 μg ml−1 control antibody MA-251 (first column) or 20 μg ml−1 daclizumab (Dac; second column) added at the beginning of culture period. Alternatively, mDCs (third column) or CFSE+ T cells (fourth column) were pre-treated with 20 μg ml−1 daclizumab for 30 min before setting up co-cultures. T cell proliferation was analyzed after five, seven, nine and, fourteen days of co-culture (first to fourth row). (b) Events of proliferated CD8+ T cells (upper panel) and CD4+ T cells (lower panel) were normalized to beads and are depicted in separate graphs. n = 4; **P < 0.01, ***P < 0.001. Mean values are shown ± SD.
Figure 3
Figure 3. T cells do not need CD25 expression to enter proliferation cycle if primed by CD25+ mDCs
(a) T cells derived from healthy donors were polyclonally activated and stained several times during the proliferation cycle for expression of CD25, CD122, and CD132 (open histograms) or the appropriate isotype controls (gray histograms) and served as positive control (left three histograms). T cells from an individual with genetic deletion of CD25 were activated and stained in parallel (right three histograms). Percentages are shown above the histograms. (b) Proliferation of CD25 CD4+ (pink; left panels) and CD8+ (blue; right panels) T cells derived from an individual with a genetic deletion of CD25 following co-incubation with Flu-HA-loaded HLA-matched CD25+ mDCs was measured by CFSE dilution after 7 d. Proliferation was inhibited when mDCs were treated with daclizumab prior to co-incubation (lower panels). Separate graphs (right panels) depict percentages and absolute numbers of CD4+ and CD8+ T cells from four replicas; *P < 0.05. Mean values are shown ± SD. (c) Cytokine production (IL-2, IFN-γ and IL-17) by proliferating CD25 CD4+ and CD8+ T cells following co-culture with CD25+ mDCs (upper panels) or mDCs pre-treated with daclizumab (lower panels).
Figure 4
Figure 4. DCs do not express the β-chain of IL-2R and therefore do not signal to IL-2
(a) Freshly isolated CD1c+ iDCs and mDCs (after 48 h of stimulation) were stained for maturation markers CD80, CD83, and MHC-II (upper panel, open histograms) and for IL-2R chains CD25, CD122, and CD132 (lower panel, open histograms) or appropriate isotype controls (filled gray histograms). Percentages of surface marker expression are depicted above the histograms. (b) In vitro generated monocyte-derived iDCs and mDCs were stained in an analogous manner. (c) IL-2 signaling and (d) GM-CSF signaling of fresh un-coagulated whole blood (ex vivo; left panels), monocyte-derived iDCs (middle panels) and mDCs (right panels) is shown. Cells were pulsed for 10 and 30 min with 50 IU ml−1 of IL-2 or 200 ng ml−1 of GM-CSF. Black filled histograms represent 0 min, open histograms 10 min and filled gray histograms 30 min after cytokine stimulation. Proportion of pStat5+ DCs after stimulation with IL-2 ranged in all conditions between 0.2%–1.5%. In contrast, proportion of pStat5+ DCs after 10 and 30 min stimulation with GM-CSF reached 86.9% and 56.3% in fresh blood, 52.9% and 80.6% in iDCs, and 51.2% and 32.3% in mDCs.
Figure 5
Figure 5. mDCs utilize their surface expression of CD25 to trans-present IL-2 to CD25 T cells
(a) Flu-HA(306–318)-specific T cells (TCL) were either selectively pre-treated for 30 min with 20μg ml−1 daclizumab (DacT) or control Ab (T) and co-incubated for 1–2 h with autologous, CD25 expressing mDCs pulsed with 1μM cognate (Flu-mDC) or non-cognate (MBP(83–99); MBP-mDC) peptide. At indicated conditions, Flu-mDCs were pre-treated with 20μg ml−1 daclizumab (DacFlu-mDC). At indicated time points cells were fixed and stained for phosphorylated Stat5. Results are displayed as percentages of pStat5 expressing CD4+ T cells ± SD. (b) Using same cells and identical conditions as in (a), this graph demonstrates the proportional number of expanded T cells after 5 d of co-culture. Mean values are shown ± SD. One representative experiment is depicted; all replicas are summarized in Supplementary Fig 6. (c) In an independent experiment, frequency of pStat5+ Flu-HA(306–318)-specific T cells was analyzed after 2 h culture with Flu-HA(306–318)-loaded mDCs (left panel), daclizumab pre-treated Flu-HA(306–318)-loaded mDCs (middle panel) and MBP(83–99) peptide-loaded mDCs (right panel). (d) Using same cells, pStat5 phosphorylation was visualized by Amnis ImageStream in Flu-specific T cells cultured for 2 h with Flu-HA(306–318)-loaded mDCs (first row), daclizumab pre-treated Flu-HA(306–318)-loaded mDCs (second row) or MBP(83–99)-loaded mDCs (third row). CD25 expression on T cells ranged between 22.6–27.7%. The left side of the figure represents cells in the bright field of the microscope; the right side depicts fluorescence images. Scale bars, 10 μm.
Figure 6
Figure 6. mDCs and T cells secrete IL-2 after Ag-specific interactions
(a) Flow cytometric analysis of IL-2 secretion of mDCs loaded with 1μM MBP(83–99) peptide (MBP-mDC; first column), MBP-specific T cells (MBP-TCC (Tc); second column), co-cultures of MBP-mDCs with MBP-specific T cells (MBP-mDC+Tc; third column) and co-cultures of mDCs loaded with 1μM Flu-HA(306–318) peptide with MBP-specific T cells (Flu-mDC+Tc; fourth column). IL-2 was detected after 1 h (upper panels) and 2 h (lower panels) of co-culture and is plotted against CD25 expression of mDCs and T cells. Percentages of IL-2 secretion by mDCs and T cells are shown in quadrants. For comparison, mDCs and T cells are presented in the same blot, but were gated separately on CD11c and CD4 expression. (b) Independent experiment visualizing secreted IL-2 and surface expression of CD25, CD11c, and CD4 by Amnis ImageStream after 2 h co-culture of MBP-mDCs with MBP-specific T cells. The upper panel of this figure shows single MBP-specific CD4+ T cells in the bright field of the microscope with simultaneous expression/secretion of fluorescently labeled CD25, CD4 and IL-2. The lower panel demonstrates conjugates of MBP-loaded mDCs with MBP-specific T cells (mDCs highlighted by purple arrows, CD4+ T cells by blue arrows). Scale bars, 10 μm.

Comment in

Similar articles

Cited by

References

    1. Waldmann TA, O’Shea J. The use of antibodies against the IL-2 receptor in transplantation. Curr Opin Immunol. 1998;10:507–512. - PubMed
    1. Nussenblatt RB, et al. Treatment of noninfectious intermediate and posterior uveitis with the humanized anti-Tac mAb: a phase I/II clinical trial. Proc Natl Acad Sci U S A. 1999;96:7462–7466. - PMC - PubMed
    1. Bielekova B, et al. Humanized anti-CD25 (daclizumab) inhibits disease activity in multiple sclerosis patients failing to respond to interferon-beta. Proc Natl Acad Sci U S A. 2004;101:8705–8708. - PMC - PubMed
    1. Bielekova B, et al. Effect of anti-CD25 antibody daclizumab in the inhibition of inflammation and stabilization of disease progression in multiple sclerosis. Arch Neurol. 2009;66:483–489. - PMC - PubMed
    1. Rose JW, et al. Daclizumab phase II trial in relapsing and remitting multiple sclerosis: MRI and clinical results. Neurology. 2007;69:785–789. - PubMed

Publication types

MeSH terms