. 2011 Apr;9(4):e1000607.
doi: 10.1371/journal.pbio.1000607. Epub 2011 Apr 12.

Dynamic analysis of stochastic transcription cycles

Affiliations

Dynamic analysis of stochastic transcription cycles

Claire V Harper et al. PLoS Biol. 2011 Apr.

Abstract

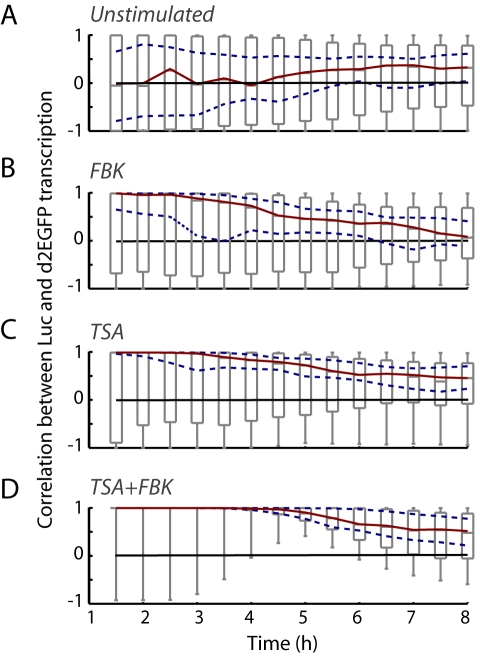
In individual mammalian cells the expression of some genes such as prolactin is highly variable over time and has been suggested to occur in stochastic pulses. To investigate the origins of this behavior and to understand its functional relevance, we quantitatively analyzed this variability using new mathematical tools that allowed us to reconstruct dynamic transcription rates of different reporter genes controlled by identical promoters in the same living cell. Quantitative microscopic analysis of two reporter genes, firefly luciferase and destabilized EGFP, was used to analyze the dynamics of prolactin promoter-directed gene expression in living individual clonal and primary pituitary cells over periods of up to 25 h. We quantified the time-dependence and cyclicity of the transcription pulses and estimated the length and variation of active and inactive transcription phases. We showed an average cycle period of approximately 11 h and demonstrated that while the measured time distribution of active phases agreed with commonly accepted models of transcription, the inactive phases were differently distributed and showed strong memory, with a refractory period of transcriptional inactivation close to 3 h. Cycles in transcription occurred at two distinct prolactin-promoter controlled reporter genes in the same individual clonal or primary cells. However, the timing of the cycles was independent and out-of-phase. For the first time, we have analyzed transcription dynamics from two equivalent loci in real-time in single cells. In unstimulated conditions, cells showed independent transcription dynamics at each locus. A key result from these analyses was the evidence for a minimum refractory period in the inactive-phase of transcription. The response to acute signals and the result of manipulation of histone acetylation was consistent with the hypothesis that this refractory period corresponded to a phase of chromatin remodeling which significantly increased the cyclicity. Stochastically timed bursts of transcription in an apparently random subset of cells in a tissue may thus produce an overall coordinated but heterogeneous phenotype capable of acute responses to stimuli.


Conflict of interest statement

The authors have declared that no competing interests exist.

Figures

Figure 1
Figure 1. Heterogeneous transcription cycles in single living cells.
Luminescence signal from (A and B) the rat pituitary GH3 cell line stably transfected with a luciferase reporter gene under the control of the hPRL 5,000 bp exon 1b promoter (GH3-DP1 cells), (C) GH3 cells stably expressing luciferase under the control of a 160 kb hPRL genomic fragment (hPRL-Luc BAC), (D–F) primary cultures of pituitary cells from transgenic rats expressing luciferase under the control of the hPRL-Luc BAC with (D and E) autosomal, and (F) X-linked transgene insertion sites. The colored lines represent data from single cells, and the average population response is shown in each graph by a thick black line (B, n = 15 cells; C, n = 18 cells; E, n = 22 cells; F, n = 20 cells). (G) Traces from individual transgenic primary cells over extended time periods. Numbers in each image series represent time in hours. Bars in image series represent 50 µm. Different regions of the promoter-reporter genes are represented in the schematic diagram by 5′- or 3′-flanking regions (grey), luciferase reporter sequence (red), and hPRL exons 1a and 2–5 (yellow, not to scale).
Figure 2
Figure 2. Measurement of transcription from two reporter genes driven by identical promoters in the same single cell.
(A) Luminescence and fluorescence measurements from GH3 cells stably expressing both the hPRL-Luc and hPRL-d2EGFP reporter genes. Intensity of the luminescence and fluorescence signal from single cells fails to correlate (data from 96 cells, four experiments are shown, depicted by different symbols, r 2 = 0.09). (B) A schematic diagram showing the conversion of transcription rate from hPRL-Luc and hPRL-d2EGFP reporter gene data. Images from each reporter gene at a single time-point are shown, as are the model parameters required to convert luciferase and d2EGFP reporter protein data into transcription rate.
Figure 3
Figure 3. Cycles of prolactin transcription from separate reporter genes within a single cell.
(A and B) Autocorrelation analysis of the reconstructed transcription rate dynamics from the hPRL-Luc and hPRL-d2EGFP reporter genes within the same single cells. (A) GH3-DP1 cells (n = 20 cells) and (B) primary transgenic cells (n = 16 cells) expressing the hPRL-Luc and hPRL-d2EGFP BAC genes.
Figure 4
Figure 4. Uncorrelated cycles of gene expression from dual reporter genes in single cells.
(A) Comparison of the dynamics of hPRL-Luc and hPRL-d2EGFP in four representative single cells. Top panels show luminescence and fluorescence images for each cell, and graphs show the dynamics of the two reporter genes from the same single cell over time (left-hand graphs, reporter-gene profiles; right-hand graphs, reconstructed transcription rates). (B) Lack of correlation over time between the transcription rates for two identical hPRL promoters in unstimulated conditions in two independent single cell clones (GH3-DP1, n = 83 cells; GH3-DP2, n = 36 cells) and primary transgenic pituitary cells (primary, n = 22 cells). The sequence of boxplots against time (T, x-axis) shows the distribution of the correlation coefficients between the timing of transcription from the two reporter genes over the cells within each pooled group (over rising increments from 1.5 h to 8 h). The red lines indicate median and the dotted blue lines show the 95% confidence interval for the median. If the zero line occurs within dotted lines, then the median is not significantly different from zero.
Figure 5
Figure 5. A binary model of transcription reveals transcription burst dynamics.
(A) Transcription “on” and “off” times were estimated using a stochastic binary (switch) model from hPRL-Luc reporter gene data from GH3-DP1 cells. (B) Estimates of transcription on duration, transcription off duration, and cycle period (on to on) were calculated for each cell (n = 35 cells) and the results given as boxplots. The red line indicates the median of the estimates, the blue box contains values lying between the lower quartile (shortest 25%) and upper quartile (longest 25%) of the estimates, and the black lines show the range of duration estimates up to the adjacent values. Outliers are shown as red crosses. (C) A scatter plot showing the relationship between the on duration and subsequent off durations within a single cell, and (D) vice versa. The minimum off period is indicated with a dotted line in (C) and (D), and the median is displayed as a red cross.
Figure 6
Figure 6. The effect of stimulation on the correlation of prolactin transcription cycles from different reporter genes.
The correlation between transcription rate profiles from the two identical hPRL promoters in (A) unstimulated GH3-DP1 cells or following stimulus with (B) FBK, (C) TSA, or (D) combined TSA+FBK. The sequence of boxplots against time is shown (as in Figure 4B; unstimulated, n = 119 cells; FBK, n = 87 cells; TSA, n = 74 cells; TSA+FBK, n = 41 cells). Greater correlation is observed between reporter genes following stimulation with TSA+FBK.
Figure 7
Figure 7. Evidence of chromatin modification in the regulation of prolactin transcription cycles.
(A) Chromatin immunoprecipitation analysis of acetylated histone H3 DNA binding at the hPRL promoter in unstimulated conditions and following 2 h treatment with FBK, TSA, or TSA+FBK. (B) Densitometric analysis from two independent experiments with intensity normalized to unstimulated conditions (mean±SD).
Figure 8
Figure 8. Kinetics of prolactin transcription bursts.
(A) The colored lines show luminescence data from the hPRL-Luc reporter gene in single representative GH3-DP1 cells in unstimulated, FBK, TSA, or TSA+FBK conditions. The thick black line in each graph shows the average from one experiment (unstimulated, n = 15 cells; FBK, n = 40 cells; TSA, n = 21 cells; TSA+FBK, n = 27 cells). (B) The effect of the treatments in (A) on the persistence of oscillations within a 30 h period. The binary model was used to quantify (C) the time to first on-phase, (D) duration of active on-phase, and (E) initial rate of transcription following the first activation after FBK, TSA, or TSA+FBK treatments.
Figure 9
Figure 9. Non-random timing of off-phases increases the cyclicity of transcriptional cycles.
Histograms showing the distribution of (A) on-times, (B) off-times, (E) off-times greater than 3 h with the refractory period, and (H) off-times greater than 3 h without the refractory period, estimated from the Markov Chain Monte Carlo algorithm (Text S1 Section 3.4). The superimposed black lines show the fit of an exponential distribution with the same mean value as the data. (C, F, and I) The off-phases in the system are not memoryless. The probability of having to wait for t hours in the off state given that the off-time has already lasted for s hours is plotted for a range of values of t for the distributions in (B, E, and H), respectively. The dashed lines represent the exponential probabilities, and the solid lines are the sample probability estimates. The uppermost lines are calculated when t = 0, the lines beneath that are calculated for t = 0.5, and so on in increments of 0.5. In a memoryless system such as that described by the telegraph process this is independent of s (hence s is constant for a given value of t), but for our system this probability decreases significantly with s during the refractory period (F). The decrease of this probability for higher values of s is due to the finite length of our time-series. (D, G, and J) Autocorrelation functions for a number of mRNA time-series simulated using on and off durations selected at random from the distributions above (B, E, and H, respectively). The variance of the time of the first peak (which estimates period) is given in each plot. In (E) the refractory period is indicated by RF.
Figure 10
Figure 10. Generation of transcription cycles.
The schematic diagram proposes a mechanistic model whereby chromatin remodeling processes generate the binary on and off stochastic cycles of transcription. χ and y denote phases of variable duration.

Comment in

References

    1. Pedraza J. M, Paulsson J. Effects of molecular memory and bursting on fluctuations in gene expression. Science. 2008;319:339–343. - PubMed
    1. Ozbudak E. M, Thattai M, Kurtser I, Grossman A. D, van Oudenaarden A. Regulation of noise in the expression of a single gene. Nat Genet. 2002;31:69–73. - PubMed
    1. Yu J, Xiao J, Ren X, Lao K, Xie X. S. Probing gene expression in live cells, one protein molecule at a time. Science. 2006;311:1600–1603. - PubMed
    1. Elowitz M. B, Levine A. J, Siggia E. D, Swain P. S. Stochastic gene expression in a single cell. Science. 2002;297:1183–1186. - PubMed
    1. Blake W. J, M K. A, Cantor C. R, Collins J. J. Noise in eukaryotic gene expression. Nature. 2003;422:633–637. - PubMed

Publication types

MeSH terms