

An administrative claims model for profiling hospital 30-day mortality rates for pneumonia patients
- PMID: 21532758
- PMCID: PMC3075250
- DOI: 10.1371/journal.pone.0017401
An administrative claims model for profiling hospital 30-day mortality rates for pneumonia patients
Abstract
Background: Outcome measures for patients hospitalized with pneumonia may complement process measures in characterizing quality of care. We sought to develop and validate a hierarchical regression model using Medicare claims data that produces hospital-level, risk-standardized 30-day mortality rates useful for public reporting for patients hospitalized with pneumonia.
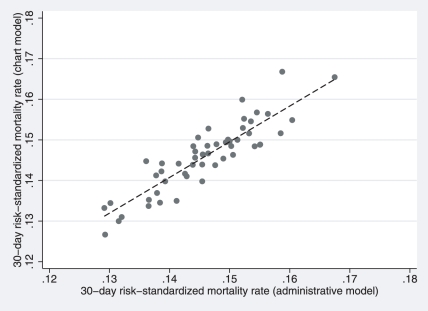
Methodology/principal findings: Retrospective study of fee-for-service Medicare beneficiaries age 66 years and older with a principal discharge diagnosis of pneumonia. Candidate risk-adjustment variables included patient demographics, administrative diagnosis codes from the index hospitalization, and all inpatient and outpatient encounters from the year before admission. The model derivation cohort included 224,608 pneumonia cases admitted to 4,664 hospitals in 2000, and validation cohorts included cases from each of years 1998-2003. We compared model-derived state-level standardized mortality estimates with medical record-derived state-level standardized mortality estimates using data from the Medicare National Pneumonia Project on 50,858 patients hospitalized from 1998-2001. The final model included 31 variables and had an area under the Receiver Operating Characteristic curve of 0.72. In each administrative claims validation cohort, model fit was similar to the derivation cohort. The distribution of standardized mortality rates among hospitals ranged from 13.0% to 23.7%, with 25(th), 50(th), and 75(th) percentiles of 16.5%, 17.4%, and 18.3%, respectively. Comparing model-derived risk-standardized state mortality rates with medical record-derived estimates, the correlation coefficient was 0.86 (Standard Error = 0.032).
Conclusions/significance: An administrative claims-based model for profiling hospitals for pneumonia mortality performs consistently over several years and produces hospital estimates close to those using a medical record model.
Conflict of interest statement
Figures


References
-
- Russo CA, Elixhauser A. Hospitalizations in the elderly population, 2003. Statistical Brief #6. Rockville: Agency for Healthcare Research and Quality; 2006. Available: http://www.hcup-us.ahrq.gov/reports/statbriefs/sb6.pdf. Accessed 2011 Mar 22. - PubMed
-
- Fry AM, Shay DK, Holman RC, Curns AT, Anderson LJ. Trends in hospitalizations for pneumonia among persons aged 65 years or older in the United States, 1988–2002. JAMA. 2005;294:2712–2719. - PubMed
-
- Anderson RN, Smith BL. Deaths: leading causes for 2002. National Vital Statistics Reports; vol 53 no 17. Hyattsville: National Center for Health Statistics; 2005. Available: http://www.cdc.gov/nchs/data/nvsr/nvsr53/nvsr53_17.pdf. Accessed 2011 Mar 22. - PubMed
-
- Centers for Medicare & Medicaid Services website. Available: http://www.qualitynet.org/dcs/ContentServer?cid=1089815967023&pagename=M.... Accessed 2011 Mar 22. - PubMed
-
- The Joint Commission website. Available: http://www.jointcommission.org/assets/1/6/Pneumonia.pdf. Accessed 2011 Mar 22.
Publication types
MeSH terms
Grants and funding
LinkOut - more resources
Full Text Sources
Medical
