

IgE mediated autoallergy against thyroid peroxidase--a novel pathomechanism of chronic spontaneous urticaria?
- PMID: 21532759
- PMCID: PMC3075251
- DOI: 10.1371/journal.pone.0014794
IgE mediated autoallergy against thyroid peroxidase--a novel pathomechanism of chronic spontaneous urticaria?
Abstract
Background: Chronic spontaneous urticaria (csU), which is characterized by recurrent episodes of mast cell-driven wheal and flare-type skin reactions, is often associated with elevated total IgE levels and thyroid autoimmunity. We speculate that some csU patients express IgE autoantibodies against thyroid antigens such as thyroid peroxidase (TPO), which could bind to skin mast cells and induce their activation.
Methods: We developed and used a site-directed human IgE capture ELISA to quantify IgE-anti-TPO. We used this assay and investigated csU patients (n = 478) and healthy control subjects (n = 127) for IgE-anti-TPO and then assessed IgE-anti-TPO-positive and -negative csU patients for clinical and serological differences.
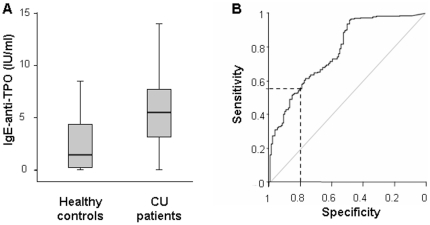
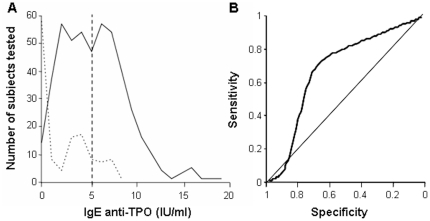
Principal findings: CsU patients were found to express more than 2fold higher IgE-anti-TPO serum levels as compared to healthy control subjects (p<0.001). 54% of csU patients had serum levels higher than the cut off ( = 5 IU/ml). By distribution analyses we identified two distinct subpopulations of csU patients: 1) IgE-anti-TPO(low) ( = 39%, IgE-anti-TPO: median 2.17 interquartile range 0.86-5.44, = comparable to healthy controls) and 2) IgE-anti-TPO(high) ( = 61%, IgE-anti-TPO: median 6.67, interquartile range 5.39-8.24). IgE-anti-TPO-positive and -negative csU patients had very similar distributions of age and gender as well as disease activity and duration. IgE-anti-TPO-positive csU patients exhibited significantly higher IgG-anti-TPO levels and lymphocyte counts as well as decreased C4 complement levels.
Conclusion: Our findings show that a sizeable subgroup of csU patients expresses IgE antibodies against thyroid peroxidase. These autoantibodies could cause "autoallergic" mast cell activation, a novel pathomechanism of chronic spontaneous urticaria.
Conflict of interest statement
Figures
References
-
- Greaves MW. Chronic idiopathic urticaria. Curr Opin Allergy Clin Immunol. 2003;3:363–368. - PubMed
-
- Mlynek A, Maurer M, Zalewska A. Update on chronic urticaria: focusing on mechanisms. Curr Opin Allergy Clin Immunol. 2008;8:433–437. - PubMed
-
- Staubach P, Vonend A, Burow G, Metz M, Magerl M, et al. Patients with chronic urticaria exhibit increased rates of sensitisation to Candida albicans, but not to common moulds. Mycoses. 2008;52:334–338. - PubMed
-
- Zuberbier T, Asero R, Bindslev-Jensen C, Walter Canonica G, Church MK, et al. EAACI/GA(2)LEN/EDF/WAO guideline: definition, classification and diagnosis of urticaria. Allergy. 2009;64:1417–1426. - PubMed
Publication types
MeSH terms
Substances
LinkOut - more resources
Full Text Sources
Medical
Miscellaneous
