. 2011 May;13(5):483-91.
doi: 10.1593/neo.11148.

Metformin suppresses ovarian cancer growth and metastasis with enhancement of cisplatin cytotoxicity in vivo

Affiliations

Metformin suppresses ovarian cancer growth and metastasis with enhancement of cisplatin cytotoxicity in vivo

Ramandeep Rattan et al. Neoplasia. 2011 May.

Abstract

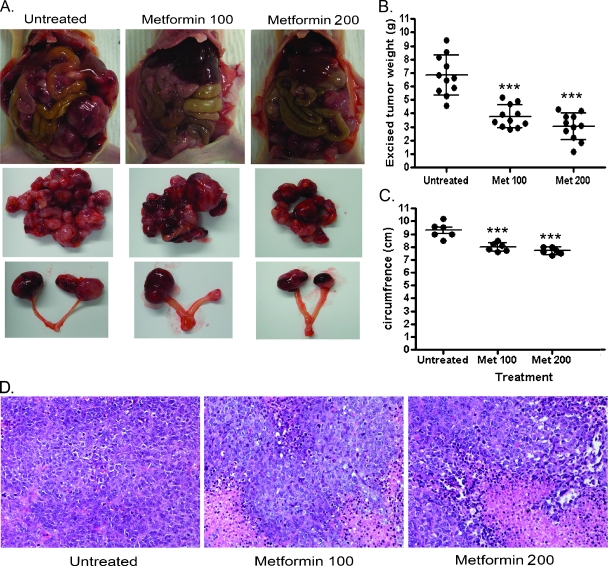
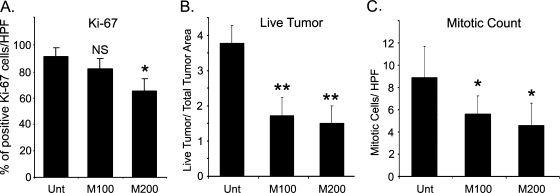
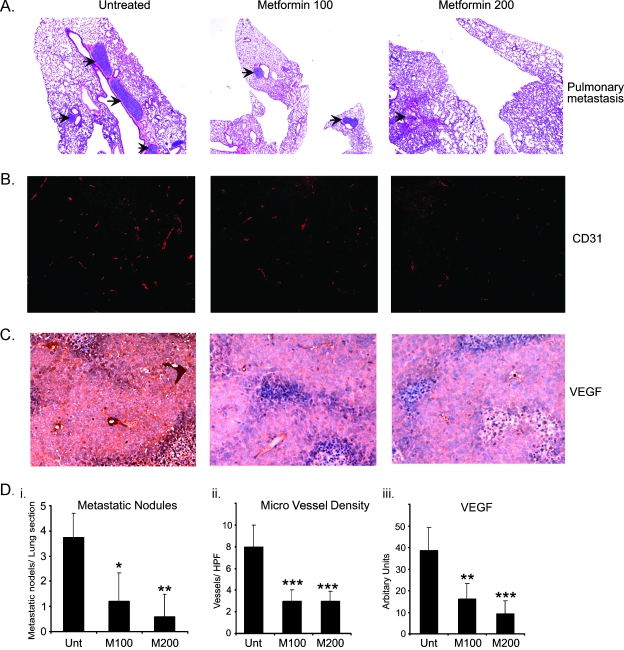
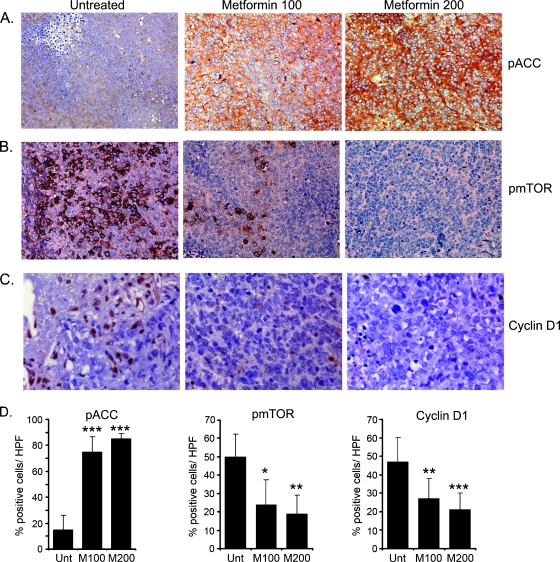
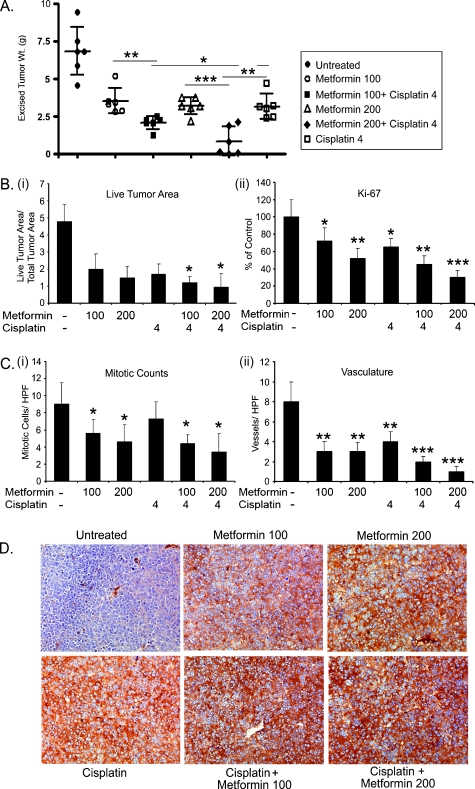
Ovarian cancer is the most lethal gynecologic cancer in women. Its high mortality rate (68%) reflects the fact that 75% of patients have extensive (>stage III) disease at diagnosis and also the limited efficacy of currently available therapies. Consequently, there is clearly a great need to develop improved upfront and salvage therapies for ovarian cancer. Here, we investigated the efficacy of metformin alone and in combination with cisplatin in vivo. A2780 ovarian cancer cells were injected intraperitoneally in nude mice; A2780-induced tumors in nude mice, when treated with metformin in drinking water, resulted in a significant reduction of tumor growth, accompanied by inhibition of tumor cell proliferation (as assessed by immunohistochemical staining of Ki-67, Cyclin D1) as well as decreased live tumor size and mitotic cell count. Metformin-induced activation of AMPK/mTOR pathway was accompanied by decreased microvessel density and vascular endothelial growth factor expression. More importantly, metformin treatment inhibited the growth of metastatic nodules in the lung and significantly potentiated cisplatin-induced cytotoxicity resulting in approximately 90% reduction in tumor growth compared with treatment by either of the drugs alone. Collectively, our data show for the first time that, in addition to inhibiting tumor cell proliferation, metformin treatment inhibits both angiogenesis and metastatic spread of ovarian cancer. Overall, our study provides a strong rationale for use of metformin in ovarian cancer treatment.


Figures

Figure 1
Figure 1
Metformin inhibits ovarian tumor growth in vivo. (A) Gross morphology of representative vivisected mouse showing A2780 tumors (top panel), excised tumor (middle panel), and tumors associated with ovary (lower panel) at 4 weeks from each group (n = 11). (B) Graph showing the excised tumor weight from each of each group (n = 11) with cumulative mean; untreated, Met 100 (metformin 100 mg/kg body weight), Met 200 (metformin 200 mg/kg body weight). ***P < .001, treated compared with the untreated group. (C) Cumulative abdominal circumference from untreated, metformin 100 mg/kg body weight (Met 100) and metformin 200 mg/kg body weight (Met 200) (n = 11) at 4 weeks. ***P < .001, treated compared with the untreated group. (D) Representative photomicrographs of H&E (x200)-stained ovarian cancer xenografts from each group.
Figure 2
Figure 2
Metformin inhibits proliferation of ovarian tumors in vivo. (A) Count of positive Ki-67-stained cells from five HPFs in each of three different tumors from each group (x400) expressed as percentage. (B) Measurement of viable tumor size as described in Materials and Methods. (C) Mitotic counts per HPF (x400) counted from five fields of three different tumors from each group. **P < .05, *P < .01, treated groups compared with untreated.
Figure 3
Figure 3
Metformin inhibits metastasis and angiogenesis in ovarian tumors in vivo. (A) Representative photomicrographs of H&E (x100)-stained lung tissues exhibiting metastasized ovarian cancer from each group. The metastatic nodules are pointed out with arrows. Lung sections from five different mice were examined. (B) Representative staining of CD31 of blood microvessels (x200) of A2780 xenografts in mice at 4 weeks. (C) Representative staining of VEGF (x400) in A2780 xenografts in mice at 4 weeks performed in five sections from each group. (D) Di: Enumeration of average number of pulmonary metastatic nodules from five H&E-stained lung sections. Dii: Count of average microvessels per HPF (x400) from five fields of three different tumor sections. Diii: Expression of VEGF was determined by Western blot from protein of tumor tissue of four individual mice per group. Graph represents the densitometric average of each group. ***P < .001, **P < .05, *P < .01, treated groups compared with the untreated group.
Figure 4
Figure 4
Metformin induces AMPK in ovarian tumors in vivo and its downstream effectors. Representative staining of pACC (A, x200), p-mTOR (B, x200, and cyclin D1 (C, x400) seen in tumor sections from each group. Five slides from each group were stained. (D) Graphical representation of percentage of positive cells counted from five HPFs (400x) per section of five different slides from each animal group. M100 indicates metformin 100 mg/kg; M200, metformin 200 mg/kg; Unt, untreated. ***P < .001, **P < .05, *P < .01, treated groups compared with the untreated group.
Figure 5
Figure 5
Metformin and cisplatin effectively combine to inhibit ovarian tumor growth. (A) Cumulative excised tumor weight from individual mice bearing A2780 xenografts at 4 weeks (n = 6) with metformin 100 and 200 mg/kg body weight in combination with cisplatin (4 mg). ***P < .001, **P < .05, *P < .01, metformin and cisplatin combination-treated groups compared with single-drug-treated group. (B) Bi: Graphical representation of viable tumor size measured from four different tumors as described before. *P < .01, combination compared with metformin and cisplatin treatment alone. Bii: Positive Ki-67 cells measured from four different tumors as described before and is represented as percentage of control. ***P < .001, **P < .05, *P < .01, treated groups compared with the untreated group. (C) Ci: Mitotic counts per HPF from six fields of three different tumors from each group. *P < .01, treated groups compared with the untreated group. Cii: Vessel counts per HPF (x400) from six HPFs of three tumors from each group. ***P < .001, **P < .05, treated groups compared with the untreated group. (D) Representative (x200) staining showing pACC indicating AMPK activation in tumor tissues excised from mice at 4 weeks.

Similar articles

Cited by

References

    1. Jemal A, Siegel R, Xu J, Ward E. Cancer statistics, 2010. CA Cancer J Clin. 2010;60:277–300. - PubMed
    1. Aletti GD, Gallenberg MM, Cliby WA, Jatoi A, Hartmann LC. Current management strategies for ovarian cancer. Mayo Clin Proc. 2007;82:751–770. - PubMed
    1. Gonzalez-Angulo AM, Meric-Bernstam F. Metformin: a therapeutic opportunity in breast cancer. Clin Cancer Res. 2010;16:1695–1700. - PMC - PubMed
    1. Ben Sahra I, Le Marchand-Brustel Y, Tanti JF, Bost F. Metformin in cancer therapy: a new perspective for an old antidiabetic drug? Mol Cancer Ther. 2010;9:1092–1099. - PubMed
    1. Rattan R, Giri S, Hartmann L, Shridhar V. Metformin attenuates ovarian cancer cell growth in an AMP-kinase dispensable manner. J Cell Mol Med. 2009;15:166–178. - PMC - PubMed

Publication types

MeSH terms