. 2011 Feb;88(3):610-633.
doi: 10.1080/00207161003640035.

A mathematical model for foreign body reactions in 2D

Affiliations

A mathematical model for foreign body reactions in 2D

Jianzhong Su et al. Int J Comput Math. 2011 Feb.

Abstract

The foreign body reactions are commonly referred to the network of immune and inflammatory reactions of human or animals to foreign objects placed in tissues. They are basic biological processes, and are also highly relevant to bioengineering applications in implants, as fibrotic tissue formations surrounding medical implants have been found to substantially reduce the effectiveness of devices. Despite of intensive research on determining the mechanisms governing such complex responses, few mechanistic mathematical models have been developed to study such foreign body reactions. This study focuses on a kinetics-based predictive tool in order to analyze outcomes of multiple interactive complex reactions of various cells/proteins and biochemical processes and to understand transient behavior during the entire period (up to several months). A computational model in two spatial dimensions is constructed to investigate the time dynamics as well as spatial variation of foreign body reaction kinetics. The simulation results have been consistent with experimental data and the model can facilitate quantitative insights for study of foreign body reaction process in general.


Figures

Figure 1
Figure 1
Figure 1a. The comparison of collagen of experimental data (the average value of samples during a 28-day period, unit: up/cm2) with a simulated data from the mathematical model. Figure 1b. The original Dale model (blue) has asymptotic collagen variable goes to increase linearly as time increases. The proposed foreign body reaction model incorporated macrophage cell using physiological principal and Mass-action law, and improved model (red) is shown to have realistic behavior. Figure 1. (c) The total collagen level for up to 40 days at different levels of A6. (d) The total collagen level for up to 40 days at different levels of B24. The normal level is the parameter used in current model.
Figure 1
Figure 1
Figure 1a. The comparison of collagen of experimental data (the average value of samples during a 28-day period, unit: up/cm2) with a simulated data from the mathematical model. Figure 1b. The original Dale model (blue) has asymptotic collagen variable goes to increase linearly as time increases. The proposed foreign body reaction model incorporated macrophage cell using physiological principal and Mass-action law, and improved model (red) is shown to have realistic behavior. Figure 1. (c) The total collagen level for up to 40 days at different levels of A6. (d) The total collagen level for up to 40 days at different levels of B24. The normal level is the parameter used in current model.
Figure 2
Figure 2
The simulated kinetics dynamics of various variables representing collagens, collagenases, TGFβs etc during first 40 days.
Figure 3
Figure 3
(a) The transient behavior of collagenase I up to 40 days at different initial levels of collagenase I, (b) The total collagen level for up to 40 days at different initial levels of collagenase I, (c) The transient behavior of collagenase III up to 40 days at different initial levels of collagenase III, (d) The total collagen level for up to 40 days at different initial levels of collagenase III.
Figure 4
Figure 4
(a) The total collagen level for up to 40 days at different initial levels of collagen I, (b) The total collagen level for up to 40 days at different initial levels of collagen III.
Figure 5
Figure 5
(a) The total collagen level for up to 40 days at different initial levels of enzyme type 1, (b) The transient behavior of fibroblast up to 40 days at different initial levels of enzyme type 1, (c) The macrophage concentration for up to 40 days at different initial levels of enzyme type 1, (d) The TGFβ concentration for up to 40 days at different initial levels of enzyme type 1, (e) The enzyme type 2 concentration for up to 40 days at different initial levels of enzyme type 1.
Figure 5
Figure 5
(a) The total collagen level for up to 40 days at different initial levels of enzyme type 1, (b) The transient behavior of fibroblast up to 40 days at different initial levels of enzyme type 1, (c) The macrophage concentration for up to 40 days at different initial levels of enzyme type 1, (d) The TGFβ concentration for up to 40 days at different initial levels of enzyme type 1, (e) The enzyme type 2 concentration for up to 40 days at different initial levels of enzyme type 1.
Figure 6
Figure 6
(a) The total collagen level for up to 40 days at different initial levels of enzyme type 2, (b) The total collagen level for up to 40 days at different initial levels of enzyme type 3.
Figure 7
Figure 7
(a) The total collagen level for up to 40 days at different initial levels of fibroblast, (b) The transient behavior of TGFβ I concentration up to 40 days at different initial levels of fibroblast, (c) The transient behavior of TGFβ III concentration up to 40 days at different initial levels of fibroblast, (d) The transient behavior of enzyme type 1 concentration up to 40 days at different initial levels of fibroblast, (e) The transient behavior of enzyme type 3 concentration up to 40 days at different initial levels of fibroblast, (f) The transient behavior of macrophage concentration up to 40 days at different initial levels of fibroblast.
Figure 7
Figure 7
(a) The total collagen level for up to 40 days at different initial levels of fibroblast, (b) The transient behavior of TGFβ I concentration up to 40 days at different initial levels of fibroblast, (c) The transient behavior of TGFβ III concentration up to 40 days at different initial levels of fibroblast, (d) The transient behavior of enzyme type 1 concentration up to 40 days at different initial levels of fibroblast, (e) The transient behavior of enzyme type 3 concentration up to 40 days at different initial levels of fibroblast, (f) The transient behavior of macrophage concentration up to 40 days at different initial levels of fibroblast.
Figure 8
Figure 8
(a) The total collagen level for up to 40 days at different initial levels of latent growth factor TGFβ I, (b) The total collagen level for up to 40 days at different initial levels of latent growth factor TGFβ III.
Figure 9
Figure 9
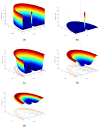
(a) The total collagen level at t=0, (b) The total collagen level at t=5 days, (c) The total collagen level at t=15 days, (d) The total collagen level at t=35 days.
Figure 10
Figure 10
(a) The initial distribution of fibroblast (t=0), (b) The total collagen level at t=5 days, (c) The total collagen level at t=15 days, (d) The total collagen level at t=35 days.
Figure 11
Figure 11
(a) The initial distribution of collagenase I (t=0), (b) The total collagen level at t=5 days, (c) The total collagen level at t=15 days, (d) The total collagen level at t=35 days.
Figure 12
Figure 12
(a) The initial distribution of latent TGFβ I (t=0), (b) The initial distribution of latent TGFβ III (t=0), (c) The total collagen level at t=5 days, (d) The total collagen level at t=15 days, (e) The total collagen level at t=35 days.

Similar articles

Cited by

References

    1. Dee KC, Puleo DA, Bizios R. An introduction to tissue-biomaterial interactions. Hoboken, John Wiley & Sons Inc; New Jersey: 2002. Wound healing; pp. 165–214.
    1. Anderson JM. Inflammation and the foreign body response. Prob Gen Surgery. 1994;11:147–160.
    1. Tang L, Eaton JW. Inflammatory responses to biomaterials. Am J Clin Path. 1995;103:466–71. - PubMed
    1. McDonald JA. Fibronectin: a primitive matrix. In: Clark RAF, Henson PM, editors. The molecular and cellular biology of wound repair. Plenum Press; New York: 1988. pp. 405–436.
    1. Appling WD, O’Brien WR, Johnston DA, Duvie M. Synergistic enhancement of type I and III collage production in cultured fibroblast by transforming growth factor - β and ascorbate. FEBS letter. 1989;250:541–544. - PubMed

LinkOut - more resources