. 2011 Apr;7(4):e1002017.
doi: 10.1371/journal.ppat.1002017. Epub 2011 Apr 21.

Engineered resistance to Plasmodium falciparum development in transgenic Anopheles stephensi

Affiliations

Engineered resistance to Plasmodium falciparum development in transgenic Anopheles stephensi

Alison T Isaacs et al. PLoS Pathog. 2011 Apr.

Abstract

Transposon-mediated transformation was used to produce Anopheles stephensi that express single-chain antibodies (scFvs) designed to target the human malaria parasite, Plasmodium falciparum. The scFvs, m1C3, m4B7, and m2A10, are derived from mouse monoclonal antibodies that inhibit either ookinete invasion of the midgut or sporozoite invasion of salivary glands. The scFvs that target the parasite surface, m4B7 and m2A10, were fused to an Anopheles gambiae antimicrobial peptide, Cecropin A. Previously-characterized Anopheles cis-acting DNA regulatory elements were included in the transgenes to coordinate scFv production with parasite development. Gene amplification and immunoblot analyses showed promoter-specific increases in transgene expression in blood-fed females. Transgenic mosquito lines expressing each of the scFv genes had significantly lower infection levels than controls when challenged with P. falciparum.


Conflict of interest statement

The authors have declared that no competing interests exist.

Figures
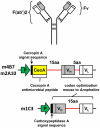
Figure 1
Figure 1. A model of the modified scFv transgenes.
A mature mouse immunoglobulin molecule consists of two heavy- and light-chain polypeptides each linked through disulfide (ss) bonds (top image). The single-chain antibodies are composed of the variable regions (Fv) of the heavy (VH) and light (VL) chains (gray and open boxes, respectively) of a mouse monoclonal antibody. The m4B7 and m2A10 scFv transgenes encode a short polypeptide linker of 5 amino acids (5aa) between VH and VL. These transgenes include sequence for a long polypeptide linker of 15 amino acids (15aa) joining the VH to the An. gambiae Cecropin A peptide (CecA), including its signal sequence. The VH region present in the m1C3 transgene is joined to the An. gambiae Carboxypeptidase A gene signal sequence, and joined by a long polypeptide linker to the VL region. Select codons in the variable region genes were codon-optimized to facilitate efficient translation. Anopheles promoter sequences (P) were joined to the scFvs to direct tissue-specific transgene expression.
Figure 2
Figure 2. Southern blot analyses of m1C3, m4B7, and m2A10 transgenic lines.
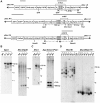
(A) Schematic representations of the single-chain antibody (scFv) transformation constructs. The scFv heavy (VH) and light (VL) variable region genes in the m1C3 construct are joined by sequence encoding a long polypeptide linker (multiple grey boxes). The sequence encoding the VH is joined to the An. gambiae carboxypeptidase A signal sequence (AgCp sig). In the m4B7 and m2A10 constructs, the An. gambiae Cecropin A gene (CecA), including signal sequences (CecA sig), is joined by sequence encoding a long polypeptide linker to the scFv VH and VL genes. The VH and VL genes are joined by a short polypeptide linker (single grey box). All three scFvs are joined to an epitope tag (E tag). The CecA-m2A10 effector gene is flanked by An. stephensi vitellogenin 1 regulatory sequences (AsVg 5′ UTR, 3′UTR), while the m1C3 and CecA-m4B7 genes are flanked by AgCP A regulatory sequences (AgCp 5′ UTR, 3′UTR). A transformation marker (EGFP or DsRed) joined to the Pax3 (3xP3) promoter and the SV40 polyadenylation sequence also is contained between the piggyBac transposase arms (pBacLH, RH). Select restriction endonuclease sites present in the transgene are indicated in the diagram. Probes used to identify the integrated transgenes are indicated by horizontal bars above each schematic representation. (B) Genomic DNA from m1C3 and wild-type control females was digested and hybridized to either an EGFP probe (left) or an m1C3 probe (right). (C) Genomic DNA from m4B7 and wild-type control females was digested and hybridized to either an EGFP probe (left) or an m4B7/AgCPA 3′UTR probe (right). (D) Genomic DNA from m2A10 and wild-type control females was digested and hybridized to an m2A10 probe. The restriction endonucleases used in each experiment are listed above the blot, and the identity of each transgenic line is listed above each lane. The locations of molecular weight markers are indicated in kilobase pairs (kb).
Figure 3
Figure 3. Expression of m1C3 P4.1, m4B7 25.1, and m2A10 44.1 transgenes.
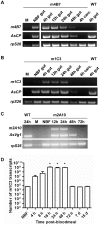
Representative results of gene amplification experiments show tissue- (A, B, C), sex- (A, B, C) and stage-specific (C) accumulation of transgene transcription products. (A) RT-PCR was used to detect m4B7 and endogenous An. stephensi carboxypeptidase A (AsCPA) transcript in RNA isolated from either whole m4B7 25.1 transgenic males (M) or dissected wild-type (WT) control, non-blood-fed m4B7 25.1 transgenic females (NBF) and m4B7 25.1 transgenic females at multiple post-bloodmeal time points (indicated above each lane). For female samples, RNA was extracted from either gut or carcass homogenates. (B) RT-PCR was used to detect m1C3 and endogenous An. stephensi carboxypeptidase A (AsCPA) transcript as described in (A). The An. stephensi S26 ribosomal protein transcript (rpS26) was amplified as a loading control in all RT-PCR experiments. (C) Accumulation of m2A10 44.1 and endogenous An. stephensi vitellogenin (AsVg1) transcript in transgenic males, non-blood-fed females, and females at multiple post-bloodmeal time points was assayed by RT-PCR. RNA was isolated from adult whole-body homogenates of wild-type control and m2A10 44.1 transgenic mosquitoes. RNA from wild-type control females was included as both a positive control for AsVg1 expression and as a negative control for m2A10 44.1 amplification. Parallel reactions in which the reverse transcription reaction step were omitted demonstrated that the observed amplification products originated exclusively from RNA (data not shown). (D) Developmental expression of m1C3 mRNA. m1C3 mRNA abundance in the midguts of females is described as transcript numbers in log-scale. Each data point represents the average of three independent biological replicates. An asterisk indicates a significantly larger number of transcripts when compared to NBF (paired T-test, one tailed p-value, 16 h p = 0.0050, 24 h p = 0.0067, 48 h p = 0.0018).
Figure 4
Figure 4. Bloodmeal-induced expression of m2A10 scFv.
(A) Immunoblot analyses of transgenic m2A10 44.1 An. stephensi. An anti-E tag antibody was used to detect m2A10 protein in whole body homogenates of transgenic females. Purified m2A10 scFv protein, which contained an E tag but did not contain Cecropin A, was used as a positive control (+). Female mosquitoes were given bloodmeals (bm) once every five days, and examined at 24, 48, 72, and 96 hours after each meal. (B) An immunoblot of both whole females (W) and a hemolymph preparation of females (H) from transgenic m2A10 44.1 and wild-type control mosquitoes (WT) 48 hours post-bloodmeal. Anti-E tag antibody was used for detection of m2A10. (C) An immunoblot of m2A10 and wild-type control female hemolymph samples, prepared in non-denaturing conditions (left panel) and probed with anti-E tag antibody. Non-bloodfed (NBF) and 24 hours post-bloodmeal (24hPBM) females were compared. NativeMark protein standard (Invitrogen) was used for molecular weight estimation. Control images of the Coomassie-stained gels are provided in Figure S1.
Figure 5
Figure 5. P. falciparum oocyst or sporozoite burden in transgenic and wild-type control mosquitoes.
Box plots display the observed distribution of oocyst per midgut or sporozoite per salivary gland pair values for wild-type control mosquitoes and m1C3 P4.1, m4B7 25.1, or m2A10 44.1 transgenic mosquitoes. The boxes in each panel represent from bottom to top the 25th to 75th percentiles, while the vertical lines and small horizontal bars delimit the minimum and maximum values. Horizontal bars within the boxes indicate the median value of each group. (A) Plots of data from all challenge experiments with m4B7 25.1 and m1C3 P4.1 mosquitoes. (B) The plot represents data from m2A10 44.1 experiments 1–4 and 5–7 separately, as indicated.

References

    1. Snow RW, Guerra CA, Noor AM, Myint HY, Hay SI. The global distribution of clinical episodes of Plasmodium falciparum malaria. Nature. 2005;434:214–217. - PMC - PubMed
    1. James AA. Gene drive systems in mosquitoes: rules of the road. Trends Parasitol. 2005;21:64–67. - PubMed
    1. Marshall JM, Taylor CE. Malaria control with transgenic mosquitoes. PLoS Med. 2009;6:e20. - PMC - PubMed
    1. Terenius O, Marinotti O, Sieglaff D, James AA. Molecular genetic manipulation of vector mosquitoes. Cell Host Microbe. 2008;4:417–423. - PMC - PubMed
    1. Nirmala X, James AA. Engineering Plasmodium-refractory phenotypes in mosquitoes. Trends Parasitol. 2003;19:384–387. - PubMed

Publication types

MeSH terms

Substances