. 2011 Apr;7(4):e1001336.
doi: 10.1371/journal.ppat.1001336. Epub 2011 Apr 21.

Respiratory syncytial virus interferon antagonist NS1 protein suppresses and skews the human T lymphocyte response

Affiliations

Respiratory syncytial virus interferon antagonist NS1 protein suppresses and skews the human T lymphocyte response

Shirin Munir et al. PLoS Pathog. 2011 Apr.

Abstract

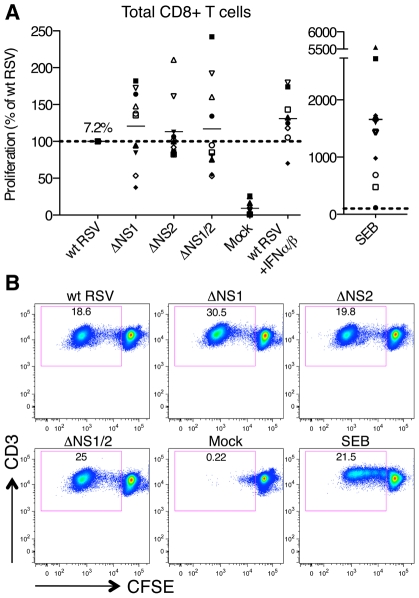
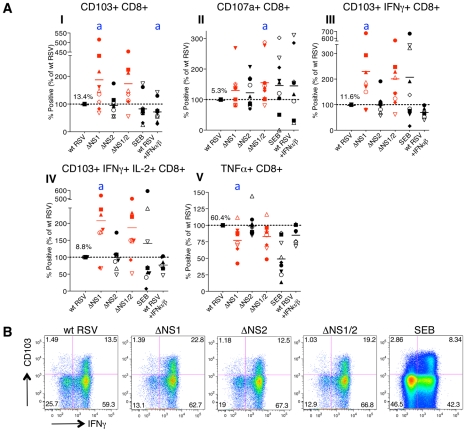
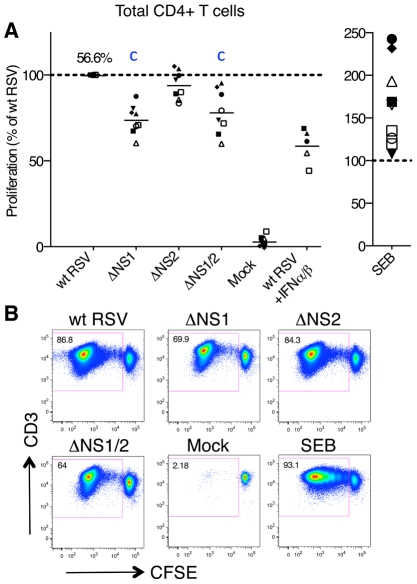
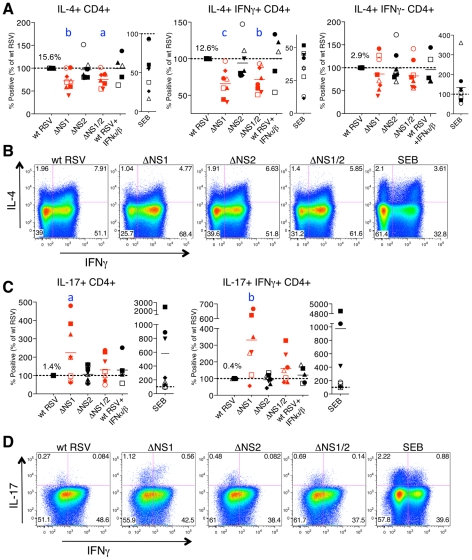
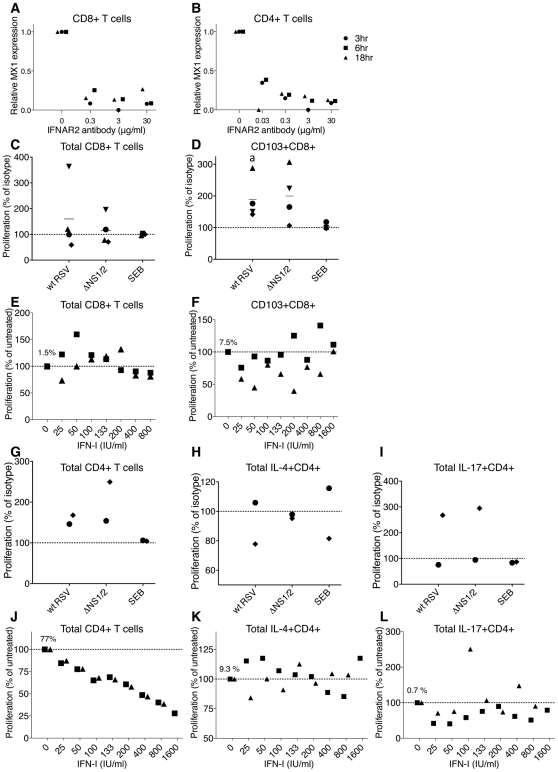
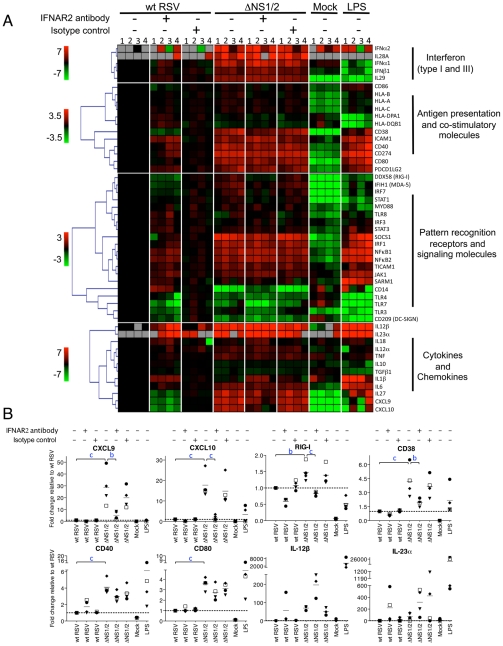
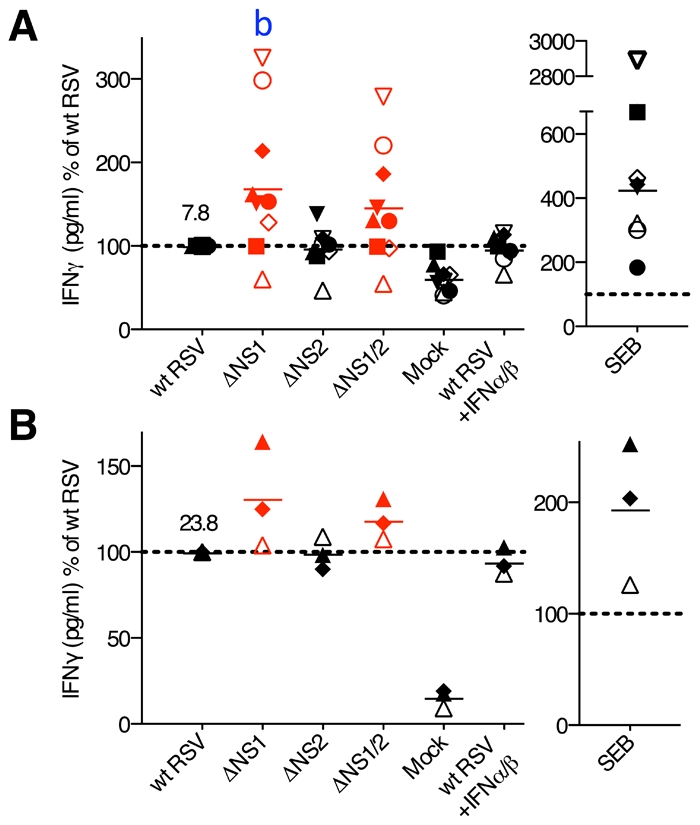
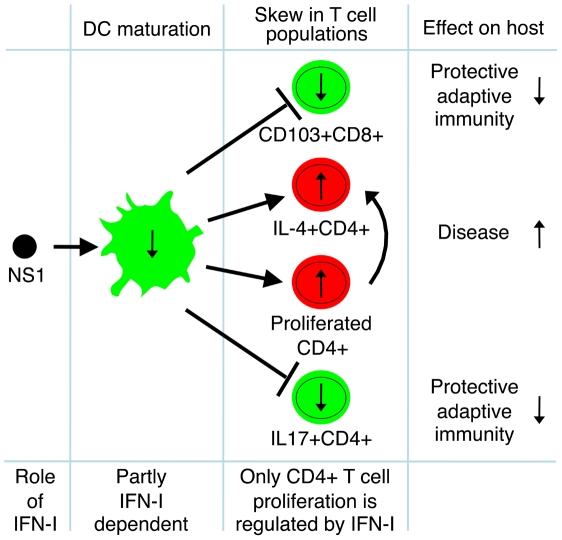
We recently demonstrated that the respiratory syncytial virus (RSV) NS1 protein, an antagonist of host type I interferon (IFN-I) production and signaling, has a suppressive effect on the maturation of human dendritic cells (DC) that was only partly dependent on released IFN-I. Here we investigated whether NS1 affects the ability of DC to activate CD8+ and CD4+ T cells. Human DC were infected with RSV deletion mutants lacking the NS1 and/or NS2 genes and assayed for the ability to activate autologous T cells in vitro, which were analyzed by multi-color flow cytometry. Deletion of the NS1, but not NS2, protein resulted in three major effects: (i) an increased activation and proliferation of CD8+ T cells that express CD103, a tissue homing integrin that directs CD8+ T cells to mucosal epithelial cells of the respiratory tract and triggers cytolytic activity; (ii) an increased activation and proliferation of Th17 cells, which have recently been shown to have anti-viral effects and also indirectly attract neutrophils; and (iii) decreased activation of IL-4-producing CD4+ T cells--which are associated with enhanced RSV disease--and reduced proliferation of total CD4+ T cells. Except for total CD4+ T cell proliferation, none of the T cell effects appeared to be due to increased IFN-I signaling. In the infected DC, deletion of the NS1 and NS2 genes strongly up-regulated the expression of cytokines and other molecules involved in DC maturation. This was partly IFN-I-independent, and thus might account for the T cell effects. Taken together, these data demonstrate that the NS1 protein suppresses proliferation and activation of two of the protective cell populations (CD103+ CD8+ T cells and Th17 cells), and promotes proliferation and activation of Th2 cells that can enhance RSV disease.


Conflict of interest statement

The authors have declared that no competing interests exist.

Figures

Figure 1
Figure 1. Co-cultivation of human DC and T cells and multi-color flow cytometetry analysis of T cells.
A. Co-cultivation of human DC pre-infected with wt RSV and its NS1/2 deletion mutants with autologous CD8+ or CD4+ T cells. Immature DC were generated in vitro from peripheral blood monocytes and were labeled with CellVue Lavender dye or DDAO. CD8+ and CD4+ T cells were purified from elutriated lymphocytes from the same donors by negative and positive selection, respectively. DC were inoculated with wt RSV or the NS1/2 deletion mutants (MOI of 2 PFU/cell), SEB-treated, or mock-treated for 4 h, and co-cultured with purified CFSE-labeled CD8+ or CD4+ T cells for 7 days. Co-culture supernatants were analyzed for the indicated cytokines by ELISA, and the T cells were stained for the indicated cytokines and activation markers followed by multicolor flow cytometry. B. Gating and analysis of CD8+ and CD4+ T cells by flow cytometry. The selected cell subset of each stage is outlined in red: gate 1, live/dead staining versus DC labels (CellVue Lavender or DDAO) to eliminate DC and dead T cells; gate 2, live/dead staining versus CD3 to obtain live CD3+ T cells; gate 3, CD8 versus CD3 (made for only CD8+ T cells) to ensure the CD3+CD8+ phenotype of the CD8+ T cells; gate 4, forward scatter height versus forward scatter area to obtain an unclustered single cell population; gate 5, side scatter area versus forward scatter area to examine cell size and granularity; and gate 6, CD3 versus CFSE to obtain proliferated CD3+ T cells, as detected by dilution of CFSE due to cell divisions. Proliferated T cells were then analyzed for the expression of individual activation markers and intracellular cytokines and also for sub-populations expressing various combinations of them by Boolean gating using FlowJo software.
Figure 2
Figure 2. Proliferation of CD8+ T cells during co-cultivation with autologous DC that had been pre-infected with wt RSV or its NS1/2 deletion mutants.
A. Extent of CD8+ T cell proliferation in response to co-culture with DC pre-infected with wt RSV or the NS1/2 deletion mutants, normalized to results with wt RSV assigned the value of 100% (dotted line). A total of 10 donors were analyzed, indicated individually by symbols, with all viruses compared in parallel for each donor. The horizontal bars represent the mean values. For wt RSV, the mean extent of CD8+ T cell proliferation (7.2%) is expressed as a percentage of the total CD8+ T cell population. No statistically significant difference between T cells co-cultivated with DC infected with various viruses was found. B. Example of primary flow cytometry data using cells from one representative donor; the percentage of each proliferated population is indicated.
Figure 3
Figure 3. The NS1 protein suppresses activation and proliferation of CD103+ CD8+ T cells.
A. Percentages of proliferating CD8+ T cells positive for the indicated markers of activation, measured after co-culture with autologous DC that had been pre-infected with the ΔNS1 (shown in red), ΔNS2 or ΔNS1/2 RSV (red) deletion mutants, as compared to cells from the same donors co-cultured with DC pre-infected with wt RSV (which was assigned a value of 100%, dotted line). In addition, a duplicate of the wt RSV co-culture was prepared containing 133 IU each of exogenously added IFNα2a and IFNβ, similar to the amounts that are produced by DC infected with the ΔNS1 virus . The markers of activation that were analyzed are indicated on the top of each panel. A total of 9 donors were analyzed, indicated individually by symbols, and the horizontal bars represent the mean values. In each panel, the mean amount of each subpopulation as a percentage of the total proliferating CD8+ T cells is shown for wt RSV. Since only proliferating cells were analyzed, cells co-cultivated with mock-infected DC were not analyzed due to their near-absence of proliferation (see Fig. 2A, B). For the ΔNS1 and ΔNS1/2 viruses, statistical significance compared to wt RSV is indicated by letter a, P<0.05. Statistical significance is also indicated for wt RSV treated with IFNα2a and IFNβ compared to un-treated wt RSV: a, P<0.05 (indicated for panel I only). B. Examples of the primary flow cytometry data with cells from one representative donor; the percentage of each proliferated population is indicated.
Figure 4
Figure 4. Proliferation of CD4+ T cells during co-cultivation with autologous DC pre-infected with wt RSV or its NS1/2 deletion mutants.
A. Extent of CD4+ T cell proliferation in response to DC infected with wt RSV or the NS1/2 deletion mutants, normalized to results with wt RSV assigned the value of 100% (dotted line). In addition, duplicate of wt RSV co-cultures were prepared containing 133 IU/ml each of exogenously added IFNα2a and IFNβ. A total of 8 donors were analyzed, represented individually by symbols, and the horizontal bars represent mean values. For wt RSV, the extent of CD4+ cell proliferation as a percentage of the total CD4+ population is indicated. For the ΔNS1 and ΔNS1/2 viruses, statistical significance compared to wt RSV is indicated by the letter c, P<0.001. B. Example of primary flow cytometry data for cells from one representative donor; the percentage of each proliferated population is indicated.
Figure 5
Figure 5. The NS1 protein affects the polarization of CD4+ T cells.
A, B. The NS1 protein shifts the phenotype of CD4+ T cells towards Th2. A. Percentages of proliferating CD4+ T cells positive for the indicated markers of activation after co-culture with autologous DC that had been pre-infected with the ΔNS1 (red), ΔNS2, and ΔNS1/2 (red) deletion mutants, as compared to the cells from the same donors co-cultivated with DC pre-infected with wt RSV (assigned a value of 100%, doted line). B. Examples of primary flow cytometry data using cells from one representative donor, with the percentage of each population indicated. C, D. The NS1 protein reduces activation and proliferation of Th17 cells. C. Percentages of proliferating CD4+ T cells positive for the indicated markers of activation after co-culture with autologous DC that had been pre-infected with the indicated virus, as compared to wt RSV in cells from the same donor as 100%. D. Examples of primary flow cytometry data using cells from one representative donor, with the percentage of each population indicated. In A-D, cells co-cultivated with mock-infected DC were not analyzed due to the near-absence of proliferation (see Fig. 4). In addition, duplicate of wt RSV co-cultures were prepared containing 133 IU/ml each of exogenously added IFNα2a and IFNβ. In A and C, the markers of activation that were analyzed are indicated on the top of each panel. A total of 8 donors were analyzed, represented by individual symbols, and the horizontal bars indicate mean values. In each panel, the amount of each subpopulation as a percentage of the total proliferating CD4+ T cells is shown for wt RSV. For the ΔNS1 and ΔNS1/2 viruses, the statistical significance of the difference to wt RSV is indicated in blue as follows: a, P<0.05; b, P<0.01, c, P<0.001.
Figure 6
Figure 6. Role of IFN-I in the proliferation of CD8+ and CD4+ T cells.
A, B. Effectiveness of an IFNAR2-blocking antibody in inhibiting IFN-I signaling. CD8+ (A) and CD4+ (B) T cells from 3 donors were incubated with the indicated concentrations of the IFNAR2 blocking antibody for 2 h, followed by stimulation with 100 IU/ml of IFNα2a. Cells were harvested at 3, 6, and 18 h post-IFN-I treatment, MX1 expression was determined by QRT-PCR and reported as relative expression normalized to cells exposed to IFN-I without antibody. C, D. Effect of IFNAR2-blocking antibodies on proliferation of total CD8+ cells (C) and CD103+CD8+ cells (D). The IFNAR2-blocking antibodies or isotype control antibodies were added to CD8+ T cells 1 h prior to their mixing with DC pre-infected with wt RSV or ΔNS1/2 RSV, and the antibodies remained during the co-culture. The level of CD8+ T cell proliferation was normalized to that for cells from the same donor incubated with isotype control antibodies, which was assigned the value of 100% (dotted line). Four donors were analyzed. The statistical significance of the difference between co-culture treated with IFNAR2-blocking antibody compared to its isotype control is indicated by the letter a, P<0.05. E, F. Effect of exogenously added IFN-I on the proliferation of total CD8+ cells (E) and CD103+CD8+ T cells (F). IFNα2a and IFNβ, each at the indicated concentration (IU/ml), were added at the beginning of co-culture of CD8+ T cells and DC that had been pre-infected with wt RSV. The amount of CD8+ T cell proliferation in each IFN-I-treated culture was normalized relative to untreated cells, which were given the value of 100% (dotted line). Two donors were analyzed. In panels E and F, the amount of proliferating CD8+ (1.5%) or CD103+CD8+ (7.5%) T cells, respectively, as a percentage of the total CD8+ T cells, is shown for wt RSV lacking exogenous IFN-I treatment. G, H, I. Effect of IFNAR2 blockade on the proliferation of total CD4+ T cells (G) or the indicated subpopulation (H and I); representative data from 2 donors. CD4+ T cells were treated with IFNAR2-blocking antibodies or isotype control antibodies for 1 h prior to their mixing with DC pre-infected with wt RSV or ΔNS1/2 RSV, with the antibodies present during the co-culture. The levels of proliferated CD4+ T cells in G, H and I are normalized to that for cells from the same donor treated with isotype control antibodies (100%, dotted line). J, K, L. Effect of exogenously added IFN-I on proliferation of total CD4+ T cells (J) or the indicated subpopulation (K and L); representative data from 2 donors. IFNα2a and IFNβ, each at the indicated concentration (IU/ml), were added at the beginning of co-culture of CD4+ T cells and DC that had been pre-infected with wt RSV. The amount of CD4+ T cell proliferation in each IFN-I-treated culture was normalized relative to untreated cells, which were given the value of 100% (dotted line). In panels J, K and L, the mean number of proliferating CD4+ cells as percentages of the total CD4+ T cells (77%, 9.3% and 0.7%, respectively) are shown for wt RSV lacking exogenous IFNα2a and IFNβ.
Figure 7
Figure 7. Effect of NS1/2 deletion and IFNAR2 blockade on the transcriptional induction of DC genes.
A. QRT-PCR analysis of RNA isolated from DC infected with wt RSV or ΔNS1/2 RSV and treated with IFNAR2 antibody, or an isotype control, or treated with LPS or mock. Total cellular RNA was harvested 48 h post-infection and analyzed by QRT-PCR for the indicated mRNAs using a microfluidic gene card. The expression fold change for each treatment was calculated relative to the calibrator, i.e., DC infected with wt RSV without the antibody treatment, converted to log2 and used for hierarchical clustering to obtain a heat map. The data from four individual donors are shown (indicated by numerals 1, 2, 3, and 4 on top of the heat map). Each row represents expression status of one gene with the gene name indicated on the right of each row. Genes were divided into four major functional categories indicated on the right of the heat map. Each functional group was clustered separately with the color bar shown on the left of the heat map representing the color range and the corresponding expression fold change indicated by it (red, up-regulated; green, down-regulated; black, no change; grey, mRNA not detected). B. Linear plots of the changes in the concentrations of mRNA for CXCL9, CXCL10, RIG-I, CD38, CD40, CD80, IL-12β, and IL-23α, from the experiment in part A. The 4 donors are indicated individually by symbols, and the horizontal bars represent the mean values. The y-axis shows expression fold change relative to wt RSV not treated with antibody. The statistical significance of difference was determined by repeated measures ANOVA with Tukey's multiple comparison post test and the significance of the difference between ΔNS1/2 and wt RSV or between ΔNS1/2 and ΔNS1/2 pretreated with IFNAR2 antibody is indicated in blue as b, P<0.01 and c, P<0.001.
Figure 8
Figure 8. Concentrations of IFNγ in the DC-T cell co-cultures.
The CD8+ (A) and CD4+ (B) T cells were co-cultured with DC pre-infected with wt RSV, ΔNS1, ΔNS2 or ΔNS1/2 RSV, and IFNγ concentrations were determined by ELISA. In addition, duplicate of wt RSV co-cultures were prepared containing 133 IU/ml each of exogenously added IFNα2a and IFNβ. The data are normalized to that for wt RSV, which was assigned the value of 100% (dotted line). 9 and 3 donors were analyzed for A and B, respectively, represented by symbols with the means indicated by horizontal bars. In each panel, the mean concentration of IFNγ in pg/ml is indicated for wt RSV. In part A, a significant difference to wt RSV is indicated by the letter b, P<0.01.
Figure 9
Figure 9. The effects of RSV NS1 protein on T cells.
A model of the effects of the RSV NS1 protein on maturation of DC, activation and proliferation of three populations of T cells (CD103+CD8+, IL-4+CD4+ and IL17+CD4+), role of IFN-I, and the effect of NS1-mediated regulation of these cell populations on the host adaptive immunity and RSV disease.

Similar articles

Cited by

References

    1. Garcia-Sastre A, Egorov A, Matassov D, Brandt S, Levy DE, et al. Influenza A virus lacking the NS1 gene replicates in interferon-deficient systems. Virology. 1998;252:324–330. - PubMed
    1. Weber F, Haller O. Viral suppression of the interferon system. Biochimie. 2007;89:836–842. - PMC - PubMed
    1. Tough DF. Type I interferon as a link between innate and adaptive immunity through dendritic cell stimulation. Leuk Lymphoma. 2004;45:257–264. - PubMed
    1. Fujita H, Asahina A, Tada Y, Fujiwara H, Tamaki K. Type I interferons inhibit maturation and activation of mouse Langerhans cells. J Invest Dermatol. 2005;125:126–133. - PubMed
    1. von Hoegen P, Zawatzky R, Schirrmacher V. Modification of tumor cells by a low dose of Newcastle disease virus. III. Potentiation of tumor-specific cytolytic T cell activity via induction of interferon-alpha/beta. Cell Immunol. 1990;126:80–90. - PubMed

Publication types

MeSH terms