. 2011 Apr;7(4):e1001368.
doi: 10.1371/journal.pgen.1001368. Epub 2011 Apr 21.

NK cell receptor/H2-Dk-dependent host resistance to viral infection is quantitatively modulated by H2q inhibitory signals

Affiliations

NK cell receptor/H2-Dk-dependent host resistance to viral infection is quantitatively modulated by H2q inhibitory signals

Nassima Fodil-Cornu et al. PLoS Genet. 2011 Apr.

Abstract

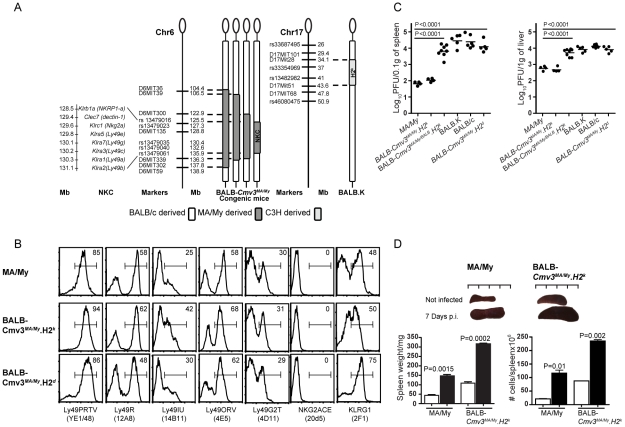
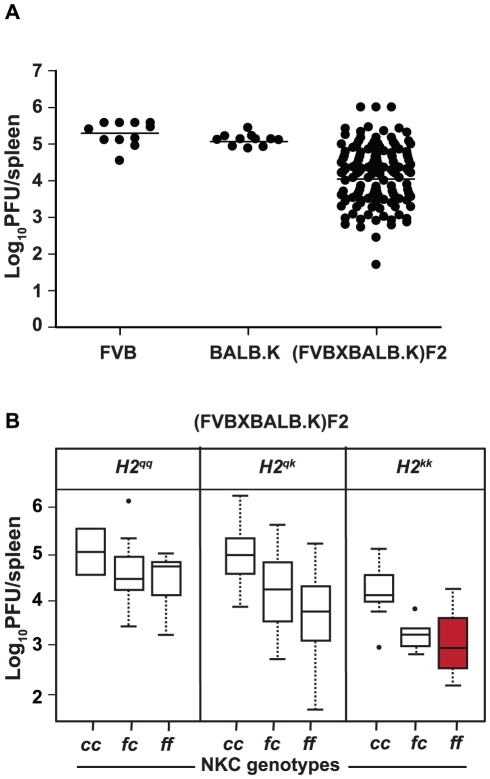
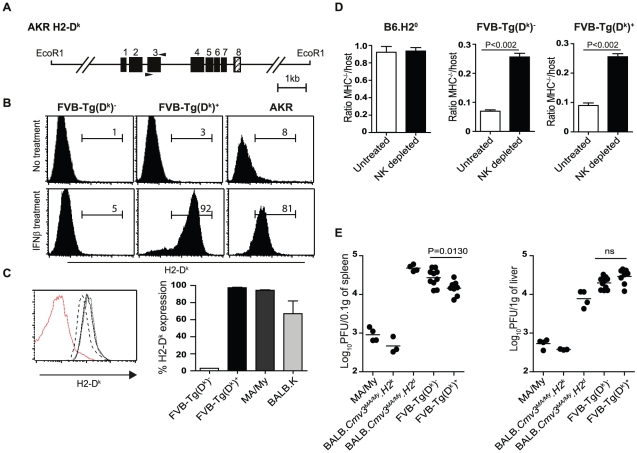
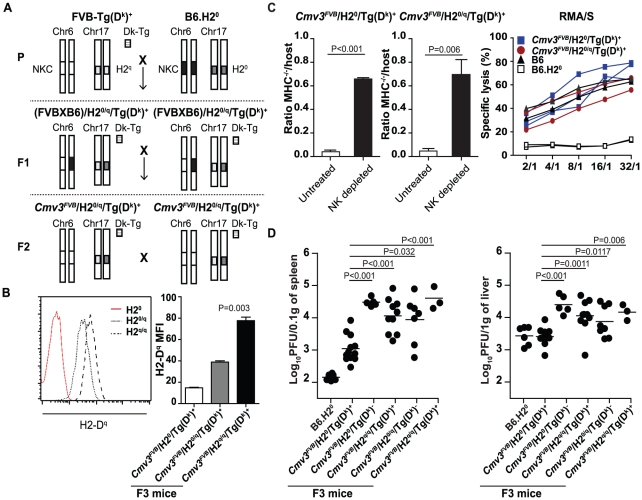
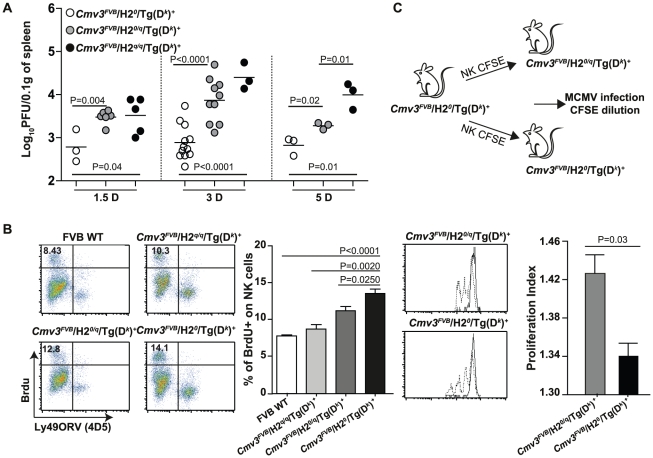
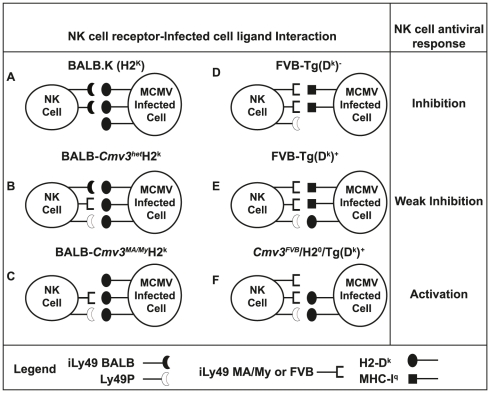
The cytomegalovirus resistance locus Cmv3 has been linked to an epistatic interaction between two loci: a Natural Killer (NK) cell receptor gene and the major histocompatibility complex class I (MHC-I) locus. To demonstrate the interaction between Cmv3 and H2(k), we generated double congenic mice between MA/My and BALB.K mice and an F(2) cross between FVB/N (H-2(q)) and BALB.K (H2(k)) mice, two strains susceptible to mouse cytomegalovirus (MCMV). Only mice expressing H2(k) in conjunction with Cmv3(MA/My) or Cmv3(FVB) were resistant to MCMV infection. Subsequently, an F(3) cross was carried out between transgenic FVB/H2-D(k) and MHC-I deficient mice in which only the progeny expressing Cmv3(FVB) and a single H2-D(k) class-I molecule completely controlled MCMV viral loads. This phenotype was shown to be NK cell-dependent and associated with subsequent NK cell proliferation. Finally, we demonstrated that a number of H2(q) alleles influence the expression level of H2(q) molecules, but not intrinsic functional properties of NK cells; viral loads, however, were quantitatively proportional to the number of H2(q) alleles. Our results support a model in which H-2(q) molecules convey Ly49-dependent inhibitory signals that interfere with the action of H2-D(k) on NK cell activation against MCMV infection. Thus, the integration of activating and inhibitory signals emanating from various MHC-I/NK cell receptor interactions regulates NK cell-mediated control of viral load.


Conflict of interest statement

The authors have declared that no competing interests exist.

Figures

Figure 1
Figure 1. Generation, phenotype, and MCMV infection outcome of BALB mice congenic for the natural killer gene complex inherited from MA/My mice.
(A) Left, physical map of chromosome 6 markers used to determine the size of the MA/My fragment introgressed into the BALB background. The four versions of chromosome 6 indicate the genotypes of sub-congenic strains produced during the generation of BALB.Cmv3MA /My congenic mice carrying a 10 Mb segment (between SNPs rs13479016 and rs13479061) spanning the NKC region from parental MA/My mice. Right, physical map of chromosome 17 markers used to characterize the 9.4 Mb segment (between D17Mit28 and D17Mit51) comprising the H2 region of BALB.K mice (H2k). (B) NK cell receptor expression in MA/My parental mice and derived BALB-Cmv3MA/MyH2d and BALB-Cmv3MA/MyH2k congenic mice. The receptors (indicated on the bottom of the panel) were gated by FACS on NKp46+ splenic NK cells; the proportion of expression is indicated in each histogram. (C) Viral load in spleens (left) and livers (right) of mice of the indicated genotypes, as determined by plaque-forming assays 3 days p.i. (D) Spleen size (top) and weight and total cellularity (bottom) determined in MA/My and BALB-Cmv3MA/MyH2k mice at 7 days p.i. White bar, uninfected mice; black bar, MCMV-infected mice. Data were analyzed using two-way ANOVA analysis and the two-tailed Student's test. Data are presented as mean ± SEM and P values of significant differences between groups are indicated. Results shown in panel B are representative of three experiments using 2–3 mice per group; results shown in panels C and D are representative of five independent experiments using 3–8 mice per group.
Figure 2
Figure 2. MCMV resistance in FVB/N×BALB.K F2 progeny dependent on specific combinations between the NKC and H2.
(A) Genetic analysis of MCMV infection control in FVB/N×BALB.K F2 progeny. Mice (FVB/N and BALB.K, n = 11 per strain; FVB/N×BALB.K F2, n = 137) were infected with 5,000 PFU of MCMV; the spleen viral titers were determined by plaque assay at day 3 p.i. (B) Box plots show the combined effect of the NKC and H2 loci derived from FVB/N (H2qq and NKCff) or BALB.K (H2kk and NKCcc) parental mice on the viral loads in the spleens of the F2 progeny. The median and interquartile ranges are shown. Solid dots denote outliers. The red box corresponds to the combination of NKCff and H2kk loci (P<6×10⁻¹¹).
Figure 3
Figure 3. Functional characterization of H2-Dk transgenic mice.
(A) Schematic representation of the H2-Dk gene within the 11.5 kb EcoRI genomic DNA fragment from AKR mice used to generate transgenic mice. (B) Expression of H2-Dk on MEFs from FVB/N nontransgenic (FVB-Tg(Dk), transgenic FVB-Tg(Dk)+, and AKR (H2k) mice. MEFs from FVB-Tg(Dk)+ and wild-type littermates were prepared from PCR-typed embryos, untreated or incubated overnight with 100 U/ml IFN-β prior to analysis of H2-Dk expression by FACS. (C) H2-Dk staining on lymphocytes from FVB-Tg(Dk) (red peak), BALB.K (dashed peak), MA/My (black peak), and FVB-Tg(Dk)+ (dotted peak) mice. Bar graph shows quantification of the percentage of H2-Dk expression from 2–3 mice per group. (D) Splenocytes from B6.H20 mice or NKC/H2 histocompatible mice were inoculated into either untreated or asialo-GM1–treated NK cell–depleted hosts. Ratio values indicate the relative survival in the test population (CFSEhigh) compared to the histocompatible control population (CFSElow) at 18 hours after injection. Three mice per group were analyzed. Statistical significance between untreated and NK-depleted mice is shown. (E) Viral load in spleens (left) and livers (right) of mice of the indicated genotypes was determined by plaque-forming assays at day 3 p.i. Data were analyzed using two-way ANOVA analysis and the two-tailed Student's test. Data are presented as mean ± SEM and P values of significant results between groups are indicated. Results shown are representative of 2–3 independent experiments.
Figure 4
Figure 4. Functional characterization of F3 mice carrying the NKC from FVB/N and different assortment of H2 molecules.
(A) Breeding scheme for the generation of F3 mice carrying the NKC loci from FVB/N parental mice and various combinations of H2 loci. The NKC, H2, and H2-Dk transgenic loci are represented by boxes, as indicated. The parental (P) FVB-Tg(Dk)+ and B6.H20 strains were mated to generate the F1 generation. Subsequently, F2 mice carrying an homozygous FVB/N NKC locus and heterozygous for either the H2 or the H2-Dk transgene were kept and intercrossed to generate the F3 mice with different H2 assortments (H20: H2-Kb −/− Db −/−). (B) H2-Dq staining of lymphocytes from Cmv3FVB/H20/Tg(Dk)+ (H20 red peak), Cmv3FVB/H20/q/Tg(Dk)+ (H20 /q, dot peak), and Cmv3FVB/H2q/q/Tg(Dk)+ mice (H2q/q, dashed peak). Histograms on the right represent the quantification of the level of H2-Dq expression analyzed in three mice per group. (C) Rejection of B6 MHC class I–deficient cells in vivo by the indicated hosts was assessed as in Figure 3, and statistically significant differences are shown. IL-2–derived NK cells from the indicated mouse strains were co-cultured with CFSE-labeled RMA/S cells. Specific lysis at the indicated effector/target ratios was assessed by staining with 7-AAD and analyzed by FACS. Values represent the mean of 2–3 mice per group. (D) Viral loads in spleens (left) and livers (right) of parental and F3 mice of the indicated genotypes were determined by plaque assay at day 3 p.i. Results shown represent five pooled experiments. Data were analyzed using two-way ANOVA analysis and the two-tailed Student's test. Significant P values for differences between groups are indicated.
Figure 5
Figure 5. H2q expression interferes with NK cell antiviral responses.
(A) MCMV viral load in the spleens of F3 transgenic mice at the indicated time-points was determined by plaque assay and P values of significant results between groups are indicated. (B) BrdU incorporation in NKp46-gated splenocytes stained with anti-BrdU and 4D5 antibodies. Splenoytes were isolated from mice of the indicated genotypes 5 days p.i. Graph bar represents the proportions of NK cells incorporating BrdU in total splenic leukocytes with standard deviations, using three mice per group. (C) Enriched NK cells from Cmv3FVB/H20/Tg(Dk)+ mice were labeled with CFSE then adoptively transferred into Cmv3FVB/H20/Tg(Dk)+ and Cmv3FVB/H20/q/Tg(Dk)+ recipients 24 hours before infection with MCMV for 5 days. Analysis of CFSE dilution in NK cells from the spleens of infected (dashed peaks) or uninfected (solid peaks) mice. NK cell proliferation index (number of divisions of CFSE-labeled NK cells) in Cmv3FVB/H20/Tg(Dk)+ and Cmv3FVB/H20/q/Tg(Dk)+ mice. Statistically significant differences between groups are indicated. Three mice per group were analyzed and results shown are representative of two experiments. Data were analyzed using two-way ANOVA analysis and the two-tailed Student's test. Significant P values for differences between groups are indicated.
Figure 6
Figure 6. Model of H2-dependent, Cmv3-determined NK response against MCMV infection.
The strength of Ly49 inhibitory signals and the presence of H2-Dk-mediated activating signals modulate the NK cell response against virus infection. Our set of NKC congenic mice bore different assortments of Ly49 receptors, but carried an identical H2k resistance haplotype. (A) NK cells from BALB.K mice had a high frequency and strong binding of inhibitory Ly49 receptors, which rendered BALB.K mice most susceptible to MCMV infection. (B) NK cells from congenic BALB.Cmv3hetH2k mice carried one copy of the activating Ly49p gene, which can activate the Ly49P/H2-Dk/m04 axis, allowing for intermediate viral loads in heterozygous mice. (C) NK cells from BALB.Cmv3MA/MyH2k mice had the lowest frequency (and/or weakest binding) of inhibitory Ly49 receptors for H2k molecules and the highest frequency of activating Ly49P+ NK cells, resulting in strong control of MCMV infection. Our set of F3 mice carried different MHC-I components, but an identical Cmv3-resistance haplotype, encoding seven inhibitory and three activating Ly49 receptors, including Ly49P. (D) Engagement of inhibitory receptors in FVB-Tg(Dk) mice resulted in inhibition of the NK cell response against MCMV. (E) In FVB-Tg(Dk)+ mice, activating signals mediated by the engagement of Ly49P by H2-Dk/m04, in the presence of inhibitory signals elicited by H2q molecules, provided a marginal enhancement of the NK cell response, and intermediate virus control. (F) In the absence of inhibitory H2q signals, H2-Dk-dependent activation of NK cells was more efficient, which resulted in strong control of MCMV infection in Cmv3FVB/H20/Tg(Dk)+ mice.

Similar articles

Cited by

References

    1. Raulet DH, Guerra N. Oncogenic stress sensed by the immune system: role of natural killer cell receptors. Nat Rev Immunol. 2009;9:568–580. - PMC - PubMed
    1. Lodoen MB, Lanier LL. Natural killer cells as an initial defense against pathogens. Curr Opin Immunol. 2006;18:391–398. - PMC - PubMed
    1. Guan H, Moretto M, Bzik DJ, Gigley J, Khan IA. NK cells enhance dendritic cell response against parasite antigens via NKG2D pathway. J Immunol. 2007;179:590–596. - PubMed
    1. Vankayalapati R, Garg A, Porgador A, Griffith DE, Klucar P, et al. Role of NK cell-activating receptors and their ligands in the lysis of mononuclear phagocytes infected with an intracellular bacterium. J Immunol. 2005;175:4611–4617. - PubMed
    1. Gonzalez VD, Landay AL, Sandberg JK. Innate immunity and chronic immune activation in HCV/HIV-1 co-infection. Clin Immunol. 2010;135:12–25. - PubMed

Publication types

MeSH terms

Substances