. 2011 Apr;7(4):e1001379.
doi: 10.1371/journal.pgen.1001379. Epub 2011 Apr 21.

Evolution meets disease: penetrance and functional epistasis of mitochondrial tRNA mutations

Affiliations

Evolution meets disease: penetrance and functional epistasis of mitochondrial tRNA mutations

Raquel Moreno-Loshuertos et al. PLoS Genet. 2011 Apr.

Abstract

About half of the mitochondrial DNA (mtDNA) mutations causing diseases in humans occur in tRNA genes. Particularly intriguing are those pathogenic tRNA mutations than can reach homoplasmy and yet show very different penetrance among patients. These mutations are scarce and, in addition to their obvious interest for understanding human pathology, they can be excellent experimental examples to model evolution and fixation of mitochondrial tRNA mutations. To date, the only source of this type of mutations is human patients. We report here the generation and characterization of the first mitochondrial tRNA pathological mutation in mouse cells, an m.3739G>A transition in the mitochondrial mt-Ti gene. This mutation recapitulates the molecular hallmarks of a disease-causing mutation described in humans, an m.4290T>C transition affecting also the human mt-Ti gene. We could determine that the pathogenic molecular mechanism, induced by both the mouse and the human mutations, is a high frequency of abnormal folding of the tRNA(Ile) that cannot be charged with isoleucine. We demonstrate that the cells harboring the mouse or human mutant tRNA have exacerbated mitochondrial biogenesis triggered by an increase in mitochondrial ROS production as a compensatory response. We propose that both the nature of the pathogenic mechanism combined with the existence of a compensatory mechanism can explain the penetrance pattern of this mutation. This particular behavior can allow a scenario for the evolution of mitochondrial tRNAs in which the fixation of two alleles that are individually deleterious can proceed in two steps and not require the simultaneous mutation of both.


Conflict of interest statement

The authors have declared that no competing interests exist.

Figures
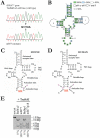
Figure 1
Figure 1. Characterization of the mt-Ti mutation.
A) Chromatogram showing the m.3739G>A mutation within the mt-Ti gene in mB77 cells. B) Conservation of mt-tRNAIle primary sequence in 150 studied mammals (http://mamit-trna.u-strasbg.fr, 2007). Percentage indicates the degree of conservation, Y (pyrimidines) R (purines). C, D) Proposed secondary structure of the tRNAIle in mouse (C) and human cells (D). The mutant nucleotides replace the wild-type ones in the anticodon loop (arrows). Wild-type and mutant nucleotides are represented in magenta and the GAU anticodon sequence is in red. Other mutations previously reported within the anticodon loop, are shown (D). E) RFLP analysis of the m.3739G>A mutation in both mB77 and the transmitochondrial clone mB77p18. The presence of the mutation creates an extra recognition site for Tru9I.
Figure 2
Figure 2. Functional analysis of OXPHOS performance.
A) Oxygen consumption rate in intact cells (n = 11, 9, 13 and 12 for TmBalb/cJ, mB77, Balbp1 and mB77p18 respectively). B) Oxygen consumption of permeabilized cells in the presence of electron donors for complex I (Glutamate + Malate), complex III (Succinate + G3P) and complex IV (TMPD) (n = 8 in all cases except for mB77p18 where n = 9). C) Growth ratio (doubling time in hours, DT) for each cell line, in a medium containing galactose and in a medium containing glucose (see Materials and Methods for details; n = 7, 5, 5 and 3 for TmBalb/cJ, mB77, Balbp1 and mB77p18 respectively). D) Spectroscopic measurement of mtDNA independent activities: citrate synthase (CS) and Complex II, in mutant and wild type cells lines (n = 3 in all cases). E) Spectroscopic measurement of isolated mitochondrial complexes I, III and IV activities in mutant and control cell lines (n≥3 in all cases). F) Estimation of the LD50 for the indicated inhibitors of the different respiratory complexes in control (TmBalb/cJ) and mutant (mB77) cells (n = 3 in both control and mutant for all inhibitors but antimycin A where n = 2; p = 0.0426 for rotenone, p = 0.3022 for 3-Nitropropionic Acid, p = 0.0181 for Antimycin A and p = 0.0460 for sodium azide). G) Evaluation of the LD50 for the indicated inhibitors of OXPHOS performance in control (TmBalb/cJ) and mutant (mB77) cells (DNP: n = 4 for control cells and n = 3 for mutants, p = 0.0278 and oligomycin: n = 3 and p = 0.0201). All values are given as mean ± SD of the mean. Asterisks indicate significant differences respect to each control, tested by ANOVA post-hoc Fisher PLSD (p<0.05).
Figure 3
Figure 3. Analysis of the biogenetic response induced by the mutation and effect of ROS scavengers.
A) mtDNA copy number variation between wild type and mutant cells without drugs (left) or in the presence of NAC (center) or Tiron (right) (n = 25, 22, 14 and 12 for TmBalb/cJ, mB77, Balbp1 and mB77p18 respectively and p<0.0001 between each mutant and its control in the absence of scavengers; n = 3 in all cases but mB77 (n = 4) and p = 0.0376 between Balbp1 and mB77p18 in the presence of NAC and n = 7, 3, 5 and 4 for TmBalb/cJ, mB77, Balbp1 and mB77p18 respectively after treatment with Tiron; p = 0.0406 between TmBalb/cJ and mB77). B) Spectroscopic measurement of specific citrate synthase activities without drugs (left) and after treatment with NAC (center) or Tiron (right) (n = 8 in all cell lines but mB77 (n = 6); p<0.0001 between TmBalb/cJ and mB77 and p = 0.0081 between Balbp1 and mB77p18 in the absence of scavengers, n = 4 in all cases in the presence of NAC and n = 3 for all cell lines after treatment with Tiron). N = NAC and T = Tiron.
Figure 4
Figure 4. Analysis of mitochondrial protein synthesis and protein synthesis sensitivity to inhibitors.
A) Fluorogram, after electrophoresis through an SDS-polyacrylamide gradient gel, of the mitochondrial translation products of the mutant and wild-type cells, labeled with [35S]-methionine for 1 hr in the presence of emetine (ND1 to 6: NADH dehydrogenase subunit 1 to 6; Cytb: Cytochrome b; COI, II and III: Cytochrome C Oxidase subunits I to III; A6 and A8: ATP synthase subunits 6 and 8). B) Differential influence of CAP and cycloheximide in wild-type (TmBalb/cJ) versus mutant (mB77) cells viability (n = 7 for control and n = 3 for mutant cells in the case of CAP (p = 0.0009) and n = 4 and 5 for control and mutant respectively in the case of cycloheximide (p = 0.5948). All values are given as mean ± SD of the mean. Asterisks indicate significant differences respect to each control, tested by ANOVA post-hoc Fisher PLSD (p<0.05).
Figure 5
Figure 5. Metabolic labeling of the assembled OXPHOS complexes.
A) Fluorogram, after BNGE, of the mitochondrial translation products of mutant and control cells, pulse-labeled with [35S]-methionine for 2 hr in the presence of cycloheximide (P) and chased (C) for 48 hours; CI-CV, complexes I to V. B) Fluorograms of two-dimensional electrophoresis (BNGE followed by SDS-PAGE), of the mitochondrial translation products obtained in b (48h chase). I-V, indicate the position of complexes I to V. Asterisks show the presence of low molecular weight subcomplexes containing CYTB and COI in mutant cell lines.
Figure 6
Figure 6. Steady-state level of respiratory complexes.
Western blot of the different assembled complexes after two-dimensional electrophoresis (BNGE followed by SDS-PAGE) probed with monoclonal antibodies specific for complexes I (anti NDUFB6 and NDUFB8), III (anti Core2), IV (anti COI) and II (anti SDHA (FP70)). The presence of subcomplexes containing complex III and complex I subunits (arrowheads) is also observed in the steady state in mutant cells.
Figure 7
Figure 7. mt-tRNA analysis in mt-Ti mouse mutants.
A) Relative tRNAIle levels in mutant and control cell lines. The radioactive signal (upper panel) obtained after hybridization of total mitochondrial RNA with the specific tRNAIle probe was normalized by the signal of the tRNAGly probe obtained from the same blot. The lower panel represents the quantification of the ratio in each cell line. B) Analysis of mt-tRNAIle precursor processing. The CCA addition to mutant and control tRNA-Ile was analyzed by allele-specific termination of primer extension. For control purposes we used synthetic mt-tRNAIle (S). The electrophoretic profiles were analyzed with the 1-D Analysis Software Quantity One. C) Analysis of the aminoacylation capacity of mutant mt-tRNAIle. The identification of the lower band as the uncharged tRNA was made by running in parallel a sample of deacylated tRNA and the quality of the samples was tested by sequential hybridization with different probes specific for mt-tRNAArg, mt-tRNATrp and mt-tRNALeu1. D) Analysis of the electrophoretic mobility of the indicated tRNAs as in C) with no urea or with 8M urea. E) Fluorogram after electrophoresis under acidic conditions of total mt-RNA samples obtained from in organello aminoacylation experiments. The assays were performed in isolated mitochondria from control and mutant cell lines using either L-[4,5-3H]-Isoleucine or L-[3,4(n)-3H]-Valine. F) LD50 of pentamidine in control (TmBalb/cJ) vs. mutant (mB77) cells (n = 3 in both cases and p = 0.0064, ANOVA post-hoc Fisher PLSD test).
Figure 8
Figure 8. The human m.4290T>C mutation promotes the same molecular and phenotypic effects as the mouse mutation.
A) Oxygen consumption rate in intact cells (n = 25 and 7, in controls and mutants, respectively p<0.0001). B) mtDNA copy number variation (n = 8 and 23 for control and mutants, respectively p = 0.0179) and H2O2 production between wild type and mutant cells n = 16 and 18 for control and mutants respectively, p<0.0001). C) Analysis of the aminoacylation capacity of mt-tRNAIle in human cells carrying the m.4290T>C mutation. The identification of the lower band as the uncharged tRNA was made by running in parallel a sample of deacylated tRNA and the quality of the samples was tested by hybridization with a different probe specific for mt-tRNAArg. D) Relative ratio of LD50 for the indicated inhibitors of the different respiratory complexes and the uncoupling or the inhibition of mitochondrial ATP synthase, (Human cells: n≥3 in all cases but sodium azide (n = 2 for control cells). Mouse cells: see Figure 2F and 2G) E) Differential influence of CAP or cycloheximide in wild-type versus mutant cells viability (CAP n = 3 in both cases and Cycloheximide: n = 4 and 8 for control and mutant cells; p = 0.0109 in the case of CAP and p = 0.5536 for cycloheximide.). Data are given as the mean ± standard deviation of the mean. Asterisks indicate significant differences respect to each control, tested by ANOVA post-hoc Fisher PLSD (p<0.05). The control group is composed by transmitochondrial cybrids belonging to different mtDNA haplogroups whereas the mutant group is formed by two independent clones (VS and KS6) belonging to haplogroup U6 and harboring the m.4290T>C mutation in homoplasmic form.
Figure 9
Figure 9. Modeling of the potential consequences of the “functional epistasis” on disease penetrance and sequence evolution of mitochondrial tRNAs.
First, a mitochondrial tRNA (mt-tRNA) mutation occurs that disestablished the functional structure of the tRNA making a second but non-functional folding similarly feasible. If the mutation reaches homoplasmy substantially reduces the availability of functional tRNA and can compromise mitochondrial protein synthesis fidelity. As a consequence mitochondria biogenesis is triggered by a ROS-induced mechanism that is modulated by genetic and environmental factors. Depending of the amplitude of the compensatory mechanism, the disease would either be prevented (or substantially ameliorated) or declared. If prevented, the mutant mtDNA could be transmitted by the female germ-line to the descendants. Within the next generation and for each new individual the same options are open again, and therefore the mutation effectively reduces the fitness of their carriers by reducing the likelihood of reproduction and would be lost in a few generations. However, this scenario substantially increases the likelihood for the emergence of a second mutation in the same molecule, a true epistatic mutation, that can render the tRNA fully functional again and that would be definitively fixed.

Similar articles

Cited by

References

    1. Ruiz-Pesini E, Lott MT, Procaccio V, Poole JC, Brandon MC, et al. An enhanced MITOMAP with a global mtDNA mutational phylogeny. Nucleic Acids Res. 2007;35:D823–828. - PMC - PubMed
    1. Jacobs HT. Disorders of mitochondrial protein synthesis. Hum Mol Genet. 2003;12:R293–301. - PubMed
    1. Chomyn A, Enriquez JA, Micol V, Fernandez-Silva P, Attardi G. The mitochondrial myopathy, encephalopathy, lactic acidosis, and stroke-like episode syndrome-associated human mitochondrial tRNALeu(UUR) mutation causes aminoacylation deficiency and concomitant reduced association of mRNA with ribosomes. J Biol Chem. 2000;275:19198–19209. - PubMed
    1. Enriquez JA, Chomyn A, Attardi G. MtDNA mutation in MERRF syndrome causes defective aminoacylation of tRNA(Lys) and premature translation termination. Nat Genet. 1995;10:47–55. - PubMed
    1. Hao R, Yao YN, Zheng YG, Xu MG, Wang ED. Reduction of mitochondrial tRNALeu(UUR) aminoacylation by some MELAS-associated mutations. FEBS Lett. 2004;578:135–139. - PubMed

Publication types