. 2011 Apr 20;6(4):e18646.
doi: 10.1371/journal.pone.0018646.

Modeling the TNFα-induced apoptosis pathway in hepatocytes

Affiliations

Modeling the TNFα-induced apoptosis pathway in hepatocytes

Rebekka Schlatter et al. PLoS One. .

Abstract

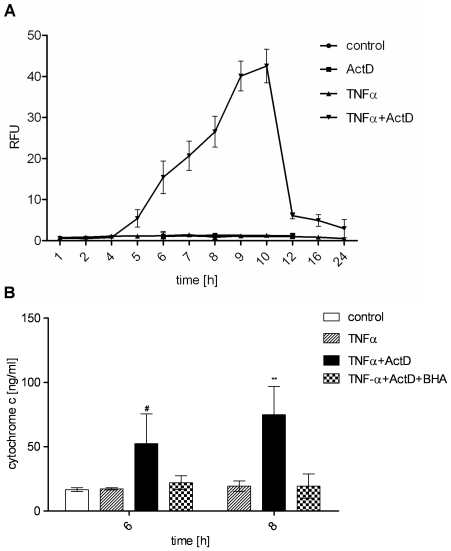
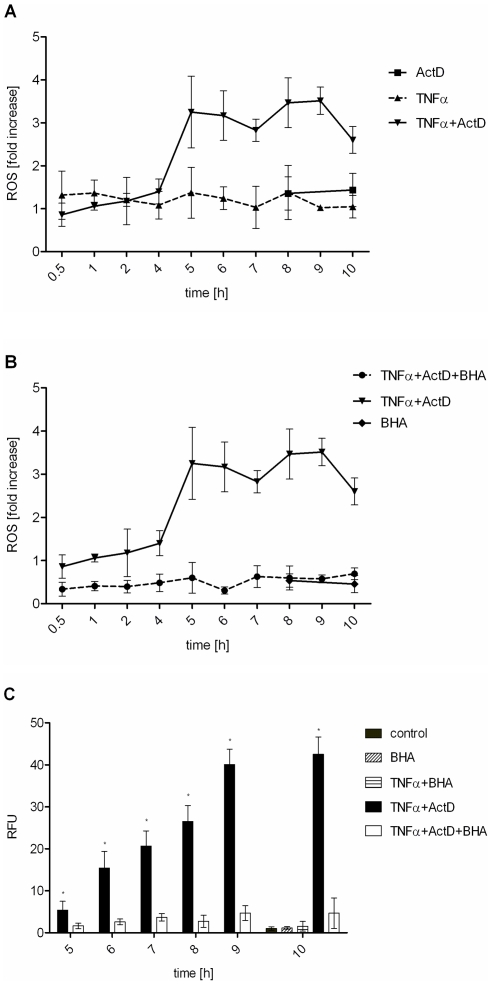
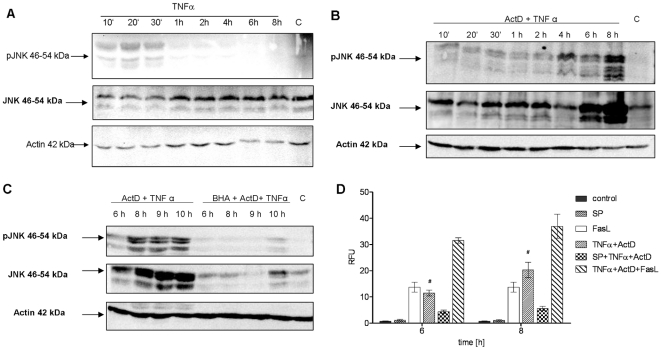
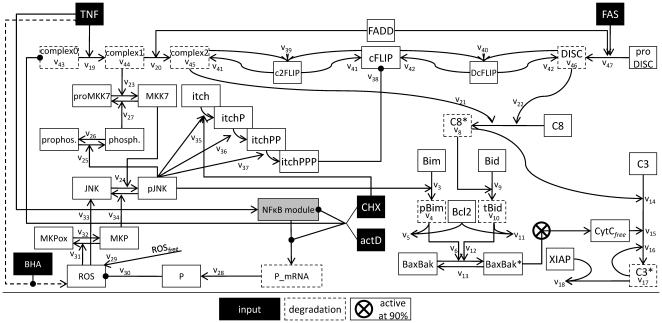
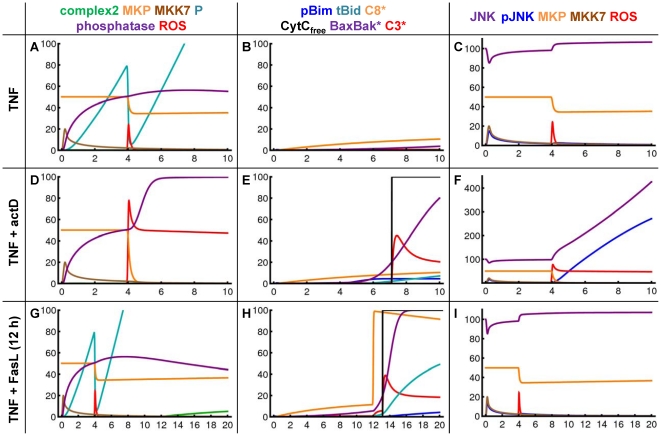
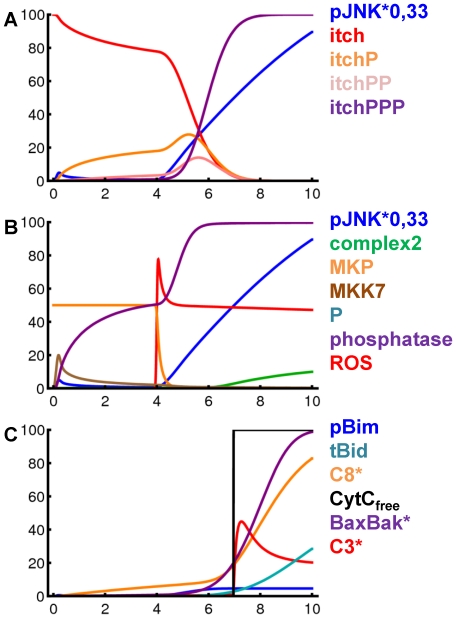
The proinflammatory cytokine TNFα fails to provoke cell death in isolated hepatocytes but has been implicated in hepatocyte apoptosis during liver diseases associated with chronic inflammation. Recently, we showed that TNFα is able to sensitize primary murine hepatocytes cultured on collagen to Fas ligand-induced apoptosis and presented a mathematical model of the sensitizing effect. Here, we analyze how TNFα induces apoptosis in combination with the transcriptional inhibitor actinomycin D (ActD). Accumulation of reactive oxygen species (ROS) in response to TNFR activation turns out to be critical for sustained activation of JNK which then triggers mitochondrial pathway-dependent apoptosis. In addition, the amount of JNK is strongly upregulated in a ROS-dependent way. In contrast to TNFα plus cycloheximide no cFLIP degradation is observed suggesting a different apoptosis pathway in which the Itch-mediated cFLIP degradation and predominantly caspase-8 activation is not involved. Time-resolved data of the respective pro- and antiapoptotic factors are obtained and subjected to mathematical modeling. On the basis of these data we developed a mathematical model which reproduces the complex interplay regulating the phosphorylation status of JNK and generation of ROS. This model was fully integrated with our model of TNFα/Fas ligand sensitizing as well as with a published NF-κB-model. The resulting comprehensive model delivers insight in the dynamical interplay between the TNFα and FasL pathways, NF-κB and ROS and gives an example for successful model integration.


Conflict of interest statement

Competing Interests: The authors have declared that no competing interests exist.

Figures

Figure 1
Figure 1. TNFα and ActD induce strong caspase-3/-7 activation and antioxidant-sensitive cytochrome c release in primary hepatocytes.
(A) Caspase-3/-7 activity determined by fluorogenic DEVDase assay of primary murine hepatocytes treated with TNFα (25 ng/ml), ActD (0.4 µg/ml) or TNFα+ActD. (B) Cytochrome c concentration determined by ELISA in the cytosol of hepatocytes after treatment with TNFα or TNFα+ActD in the presence or absence of the antioxidant BHA (100 µM) for the indicated times. Means of at least three independent experiments ± s.d. are shown (** P<0.01, # P<0.05 both versus TNFα-treated cells, Student's t-test).
Figure 2
Figure 2. TNFα plus ActD induce antioxidant-sensitive ROS accumulation which is critical for caspase-3/-7 activation.
(A) Hepatocytes were treated with TNFα (25 ng/ml), ActD (0.4 µg/ml) or TNFα+ActD and ROS measured by dichlorofluorescin fluorescence assay and referred to untreated control. (B) ROS accumulation determined when cells were preincubated with the antioxidant BHA (100 µM) for 30 minutes before TNFα+ActD treatment. (C) Caspase-3/-7 activation of cells treated with TNFα, TNFα+ActD or both preincubated with BHA. Values represent means of at least three independent experiments ± s.d. (* P<0.001 versus TNFα+ActD+BHA-treated cells, Student's t-test).
Figure 3
Figure 3. Sustained activation of JNK after TNFα plus ActD is ROS-dependent and involved in caspase-3/-7 activation.
(A) Western blot analysis of JNK and phospho-JNK (P-JNK) after treatment with TNFα (25 ng/ml) for the indicated times. (B) JNK and P-JNK levels determined by Western blot analysis in cells treated with TNFα (25 ng/ml) and ActD (ActD) (0.4 µg/ml) for the indicated times. (C) Analysis of JNK and P-JNK by Western blot after treatment of hepatocytes with TNFα+ActD with or without preincubation with BHA 100 µM for the indicated times. Actin is used as loading control. One representative experiment is shown. (D) Caspase-3/-7 activation of cells treated with TNFα+ActD with or without preincubation with the JNK inhibitor SP600125 20 µM. For comparison, cells were also treated with FasL (50 ng/ml) for 6 hours with or without costimulation with TNFα+ActD for the indicated times. Means of at least three independent experiments ± s.d. are shown (# P<0.05 versus TNFα+ActD-treated cells, Student's t-test).
Figure 4
Figure 4. TNFα induces NF-κB activation but fails to upregulate cFLIP and MnSOD protein.
(A) Kinetics of NF-κB-DNA binding activity measured by EMSA in hepatocytes treated with TNFα (25 ng/ml) for the indicated times. Means of at least three independent experiments ± s.d. are shown. cFLIPL/S (B) and MnSOD (C) protein levels determined by Western Blot analysis in primary murine hepatocytes and mouse embryonic fibroblasts (B, left panel) treated with TNFα (25 ng/ml) with or without ActD (0.4 µg/ml) for the indicated times. Actin is used as loading control. One representative experiment is shown.
Figure 5
Figure 5. Schema of the mathematical TNFα-induced apoptosis model.
Illustration of the model structure in accordance to the model equations introduced in the Modeling section. Input stimuli of the model are TNFα, Fas ligand, BHA, ActD (actD) and cycloheximide (CHX). The NF-κB model is depicted as grey box for clarity. The kinetic parameters are indicated to assign the equations to the schema. Production rates are written into the boxes for the according species. Species which are degraded in the model are framed with dashed lines.
Figure 6
Figure 6. Simulation results of the TNFα-induced apoptosis model after TNFα, TNFα plus ActD and TNFα/Fas ligand sensitizing.
Simulation results for pivotal species of the TNFα-induced apoptosis model after stimulation with TNFα only (A–C), with TNFα plus ActD (D–F) over 10 hours or after TNFα/Fas ligand sensitizing (12 h TNFα preincubation before Fas stimulus) (G–I) over 20 hours. The species are shown in separate panels for clarity as indicated in the legend.
Figure 7
Figure 7. Simulation results of the TNFα-induced apoptosis model after TNFα plus cycloheximide.
(A–C) Simulation results for pivotal species of the TNFα-induced apoptosis model over 10 hours after stimulation with TNFα plus cycloheximide. The amount of pJNK is reduced to one third for this Figure. The species are shown in separate panels for clarity as indicated in the legend.

References

    1. Canbay A, Friedman S, Gores GJ. Apoptosis: the nexus of liver injury and fibrosis. Hepatology. 2004;39:273–278. - PubMed
    1. Wajant H, Pfizenmaier K, Scheurich P. Tumor necrosis factor signaling. Cell Death Differ. 2003;10:45–65. - PubMed
    1. Micheau O, Tschopp J. Induction of TNF receptor I-mediated apoptosis via two sequential signaling complexes. Cell. 2003;114:181–190. - PubMed
    1. Wullaert A, Heyninck K, Beyaert R. Mechanisms of crosstalk between TNF-induced NF-kappaB and JNK activation in hepatocytes. Biochem Pharmacol. 2006;72:1090–1101. - PubMed
    1. Youle RJ, Strasser A. The BCL-2 protein family: opposing activities that mediate cell death. Nat Rev Mol Cell Biol. 2008;9:47–59. - PubMed

Publication types