Comparative Study
. 2011 Apr 18;6(4):e18876.
doi: 10.1371/journal.pone.0018876.

Functional connectivity fMRI of the rodent brain: comparison of functional connectivity networks in rat and mouse

Affiliations
Comparative Study

Functional connectivity fMRI of the rodent brain: comparison of functional connectivity networks in rat and mouse

Elisabeth Jonckers et al. PLoS One. .

Abstract

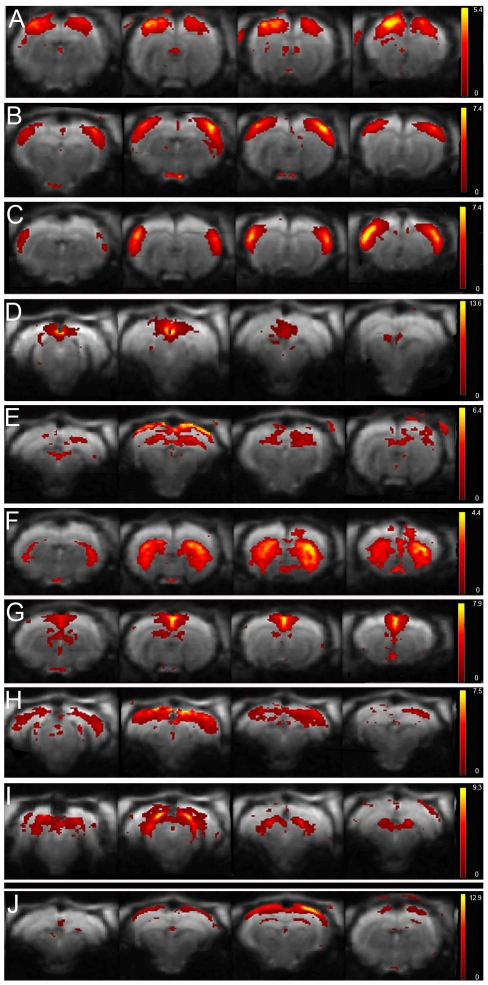
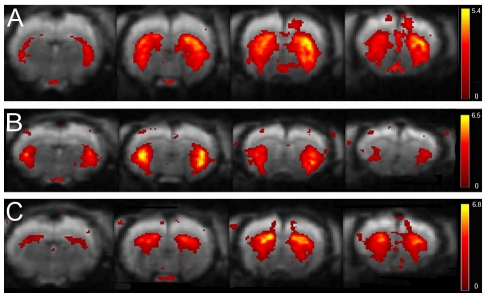
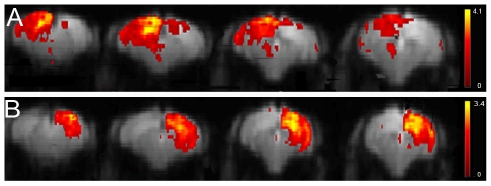
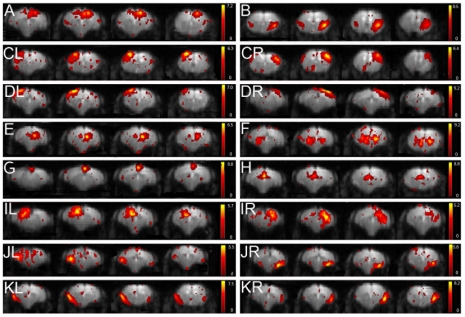
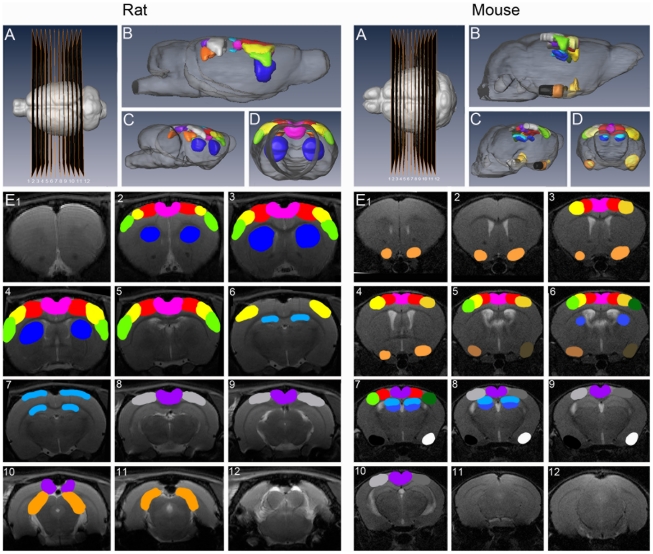
At present, resting state functional MRI (rsfMRI) is increasingly used in human neuropathological research. The present study aims at implementing rsfMRI in mice, a species that holds the widest variety of neurological disease models. Moreover, by acquiring rsfMRI data with a comparable protocol for anesthesia, scanning and analysis, in both rats and mice we were able to compare findings obtained in both species. The outcome of rsfMRI is different for rats and mice and depends strongly on the applied number of components in the Independent Component Analysis (ICA). The most important difference was the appearance of unilateral cortical components for the mouse resting state data compared to bilateral rat cortical networks. Furthermore, a higher number of components was needed for the ICA analysis to separate different cortical regions in mice as compared to rats.


Conflict of interest statement

Competing Interests: The authors have declared that no competing interests exist.

Figures

Figure 1
Figure 1. Functional connectivity maps resulting from 15 components ICA (GIFT) of rat rsfMRI.
The figure shows 4 axial slices covering the anatomical area of each of the 9 mean components. The spatial colour-coded z-maps of these components are overlaid on the GE-EPI image. A higher z-score (yellow) represents a higher correlation between the time course of that voxel and the mean time course of this component. Mean components comprise (top-bottom) A) motorcortex, B) somatosensory cortex, C) auditory cortex, D) retrosplenial (dys)granular cortex, E) hippocampus, F) striatum, G) cingulate cortex, H) visual cortex and I) inferior colliculus; J) example of one slice effect.
Figure 2
Figure 2. Striatal functional connectivity maps resulting from 15 and 40 components ICA (GIFT) of rat rsfMRI.
The figure shows 4 axial slices of mean components, located at the striatum. The spatial colour-coded z-maps of these components are overlaid on the GE-EPI image. A higher z-score (yellow) represents a higher correlation between the time course of that voxel and the mean time course of this component. For the 15 component analysis (A) the striatum was shown confined in only one component but was divided over two components for the 40 component analysis (B & C).
Figure 3
Figure 3. Cortical functional connectivity maps resulting from 15 components ICA (GIFT) of mouse rsfMRI.
The figure shows 4 slices of 2 mean components, demonstrating the separation in the left (A) and right cortex (B). The spatial colour-coded z-maps (axial) of these components are overlaid on the GE-EPI image. A higher z-score (yellow) represents a higher correlation between the time course of that voxel and the mean time course of this component.
Figure 4
Figure 4. Functional connectivity maps resulting from 40 components ICA (GIFT) of mouse rsfMRI.
The figure shows 4 axial slices of the 16 mean components. The spatial colour-coded z-maps of these components are overlaid on the GE-EPI image. A higher z-score (yellow) represents a higher correlation between the time course of that voxel and the mean time course for this component. Mean components comprise (top-bottom) A) motorcortex, B) piriform cortex, CL) left somatosensory cortex, CR) right somatosensory cortex, DL) left auditory cortex, DR) right auditory cortex, E) right hippocampus (dorsal), F) ventral hippocampus, G) retrosplenial (dys)granular cortex, H) cingulate cortex, IL) left visual cortex, IR) right visual cortex, JL) left medial entorhinal cortex, JR) right medial entorhinal cortex, KL) left lateral entorhinal cortex and KR) right lateral entorhinal cortex.
Figure 5
Figure 5. Schematic overview of the localization of different components shown in Figure 1 and 4.
Left overview of the components resulting of the 15 component rat data analysis, right overview of the components resulting of the 40 component mouse data analysis. Both Panels A show the localization of the slices (1-12) from left to right. Panels B, C and D give a 3D surface rendered overview of the localization of the different components shown in figure 1 & 4 (B =  sagital, C = oblique, D =  axial view). Panels E gives this overview overlaid on RARE images. Colourcode: Rat: motorcortex (red), colliculus inferior (light orange), somatosensory cortex (yellow), auditory cortex (green), hippocampus (light blue), striatum (dark blue), retrosplenial (dys)granular cortex (purple), cingulate cortex (pink), visual cortex (grey). Mice: motorcortex (red), piriform cortex (orange), left somatosensory cortex (light yellow), right somatosensory cortex (dark yellow), left auditory cortex (light green), right auditory cortex (dark green), right dorsal hippocampus (light blue), ventral hippocampus (middle blue), retrosplenial (dys)granular cortex (purple), cingulate cortex (pink), left visual cortex (light grey) right visual cortex (dark grey), left medial entorhinal cortex (light brown), right medial entorhinal cortex (dark brown), left lateral entorhinal cortex and (white) right lateral entorhinal cortex (black).
Figure 6
Figure 6. Reproducibility between sessions and between subjects of 15 components ICA (GIFT) of rat rsfMRI.
Left: Pictures showing session cumulative score maps for 9 selected mean ICA rat components (central slice) over the different time points overlaid on the GE-EPI image. Colour-code: voxels with z-value higher than 1 for one time point (blue), two time points (blue-green), three time points (orange), four time points (red). Right: Pictures showing animal cumulative score maps for 9 selected ICA rat components (central slice) of the five rats overlaid on the GE-EPI image. Colour-code: voxels with z-value higher than 1 for one animal (blue), two animals (blue-green), three animals (orange), four animals (red), five animals (pink).
Figure 7
Figure 7. Reproducibility between subjects of 40 components ICA (GIFT) of mouse rsfMRI.
Pictures showing animal cumulative score maps for 16 selected ICA mice components (central slice) of the nine mice overlaid on the GE-EPI image. Colour-code: voxels with z-value higher than 1 for five animals (blue), six animals (blue-green), seven animals (orange), eight animals (red), nine animals (pink).

References

    1. Biswal B, Yetkin FZ, Haughton VM, Hyde JS. Functional connectivity in the motor cortex of resting human brain using echo-planar MRI. Magn Reson Med. 1995;34:537–541. - PubMed
    1. van den Heuvel MP, Hulshoff Pol HE. Exploring the brain network: a review on resting-state fMRI functional connectivity. Eur Neuropsychopharmacol. 2010;20:519–534. - PubMed
    1. Damoiseaux JS, Beckmann CF, Arigita EJ, Barkhof F, Scheltens P, et al. Reduced resting-state brain activity in the “default network” in normal aging. Cereb Cortex. 2008;18:1856–1864. - PubMed
    1. Damoiseaux JS, Rombouts SA, Barkhof F, Scheltens P, Stam CJ, et al. Consistent resting-state networks across healthy subjects. Proc Natl Acad Sci U S A. 2006;103:13848–13853. - PMC - PubMed
    1. Greicius MD, Flores BH, Menon V, Glover GH, Solvason HB, et al. Resting-state functional connectivity in major depression: abnormally increased contributions from subgenual cingulate cortex and thalamus. Biol Psychiatry. 2007;62:429–437. - PMC - PubMed

Publication types