

Comparative gene expression profiles induced by PPARγ and PPARα/γ agonists in human hepatocytes
- PMID: 21533120
- PMCID: PMC3078935
- DOI: 10.1371/journal.pone.0018816
Comparative gene expression profiles induced by PPARγ and PPARα/γ agonists in human hepatocytes
Abstract
Background: Several glitazones (PPARγ agonists) and glitazars (dual PPARα/γ agonists) have been developed to treat hyperglycemia and, simultaneously, hyperglycemia and dyslipidemia, respectively. However, most have caused idiosyncratic hepatic or extrahepatic toxicities through mechanisms that remain largely unknown. Since the liver plays a key role in lipid metabolism, we analyzed changes in gene expression profiles induced by these two types of PPAR agonists in human hepatocytes.
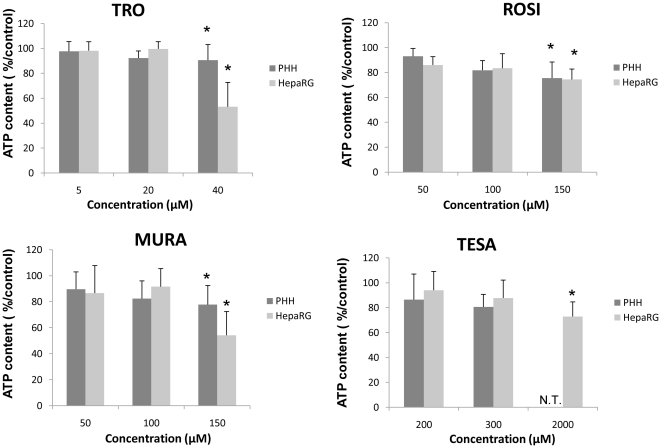
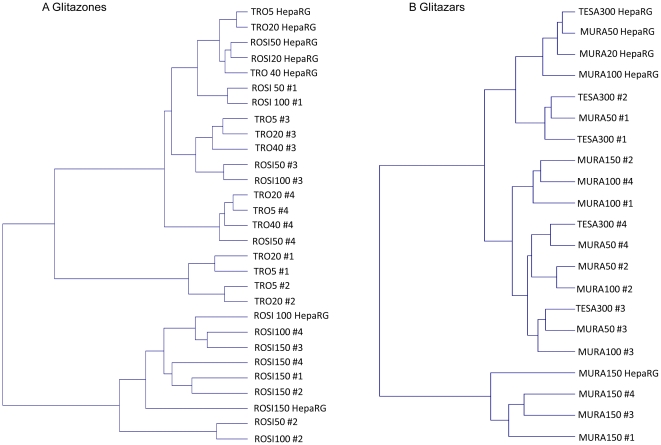
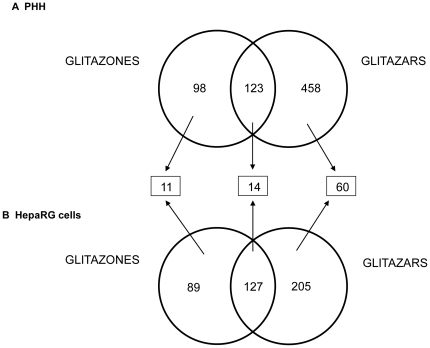
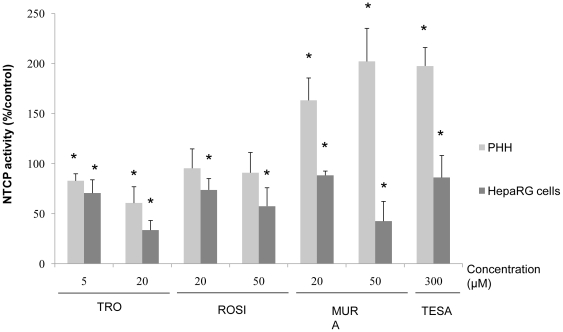
Methodology/principal findings: Primary human hepatocytes and the well-differentiated human hepatoma HepaRG cells were exposed to different concentrations of two PPARγ (troglitazone and rosiglitazone) and two PPARα/γ (muraglitazar and tesaglitazar) agonists for 24 h and their transcriptomes were analyzed using human pangenomic Agilent microarrays. Principal Component Analysis, hierarchical clustering and Ingenuity Pathway Analysis® revealed large inter-individual variability in the response of the human hepatocyte populations to the different compounds. Many genes involved in lipid, carbohydrate, xenobiotic and cholesterol metabolism, as well as inflammation and immunity, were regulated by both PPARγ and PPARα/γ agonists in at least a number of human hepatocyte populations and/or HepaRG cells. Only a few genes were selectively deregulated by glitazars when compared to glitazones, indicating that PPARγ and PPARα/γ agonists share most of their target genes. Moreover, some target genes thought to be regulated only in mouse or to be expressed in Kupffer cells were also found to be responsive in human hepatocytes and HepaRG cells.
Conclusions/significance: This first comprehensive analysis of gene regulation by PPARγ and PPARα/γ agonists favor the conclusion that glitazones and glitazars share most of their target genes and induce large differential changes in gene profiles in human hepatocytes depending on hepatocyte donor, the compound class and/or individual compound, thereby supporting the occurrence of idiosyncratic toxicity in some patients.
Conflict of interest statement
Figures
References
-
- Feige JN, Gelman L, Michalik L, Desvergne B, Wahli W. From molecular action to physiological outputs: peroxisome proliferator-activated receptors are nuclear receptors at the crossroads of key cellular functions. Prog Lipid Res. 2006;45:120–159. - PubMed
-
- Michalik L, Auwerx J, Berger JP, Chatterjee VK, Glass CK, et al. International Union of Pharmacology. LXI. Peroxisome proliferator-activated receptors. Pharmacol Rev. 2006;58:726–741. - PubMed
-
- Staels B, Fruchart JC. Therapeutic roles of peroxisome proliferator-activated receptor agonists. Diabetes. 2005;54:2460–2470. - PubMed
-
- Guo L, Zhang L, Sun Y, Muskhelishvili L, Blann E, et al. Differences in hepatotoxicity and gene expression profiles by anti-diabetic PPAR gamma agonists on rat primary hepatocytes and human HepG2 cells. Mol Divers. 2006;10:349–360. - PubMed
-
- Fievet C, Fruchart JC, Staels B. PPARalpha and PPARgamma dual agonists for the treatment of type 2 diabetes and the metabolic syndrome. Curr Opin Pharmacol. 2006;6:606–614. - PubMed
Publication types
MeSH terms
Substances
LinkOut - more resources
Full Text Sources
