. 2011 Apr 18;6(4):e18925.
doi: 10.1371/journal.pone.0018925.

Imatinib treatment induces CD5+ B lymphocytes and IgM natural antibodies with anti-leukemic reactivity in patients with chronic myelogenous leukemia

Affiliations

Imatinib treatment induces CD5+ B lymphocytes and IgM natural antibodies with anti-leukemic reactivity in patients with chronic myelogenous leukemia

Silvia Catellani et al. PLoS One. .

Abstract

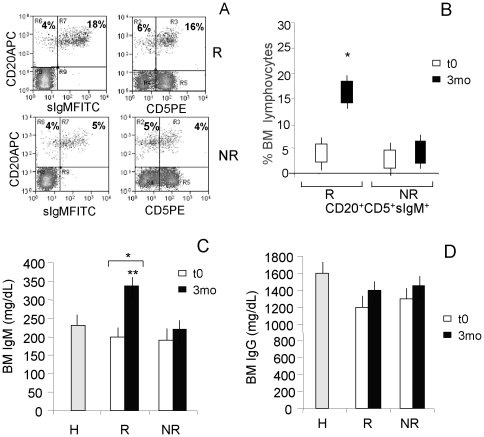
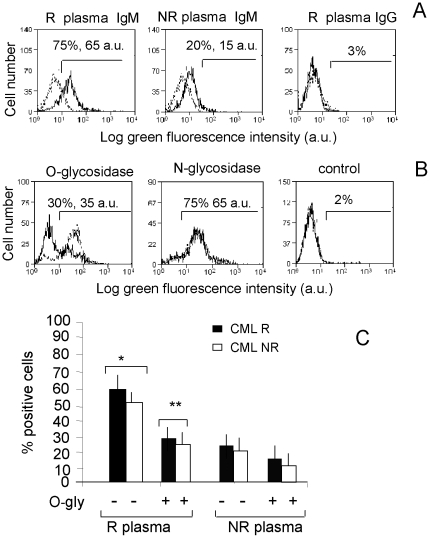
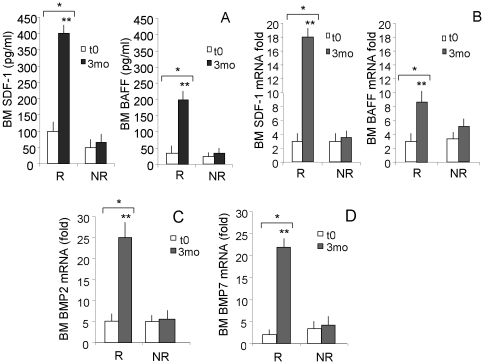
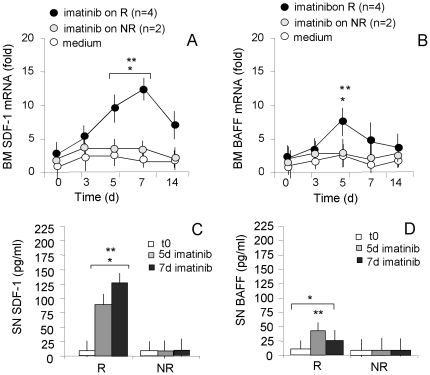
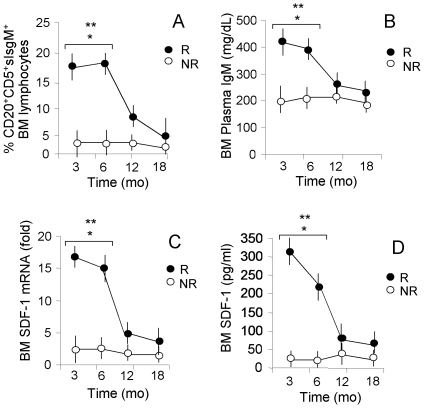
Imatinib mesylate is a first line treatment of Chronic Myelogenous Leukemia and of a rare form of gastrointestinal stromal cancer, where the response to the drug is also linked to the immune system activation with production of antineoplastic cytokines. In this study, forty patients in the chronic phase of disease, treated with imatinib mesylate, were analyzed. Bone marrow aspirates were drawn at diagnosis, after 3, 6, 12, 18 months for haematological, cytofluorimetric, cytogenetic, biomolecular evaluation and cytokine measurement. Responder and non responder patients were defined according to the European LeukemiaNet recommendations. In responder patients (n = 32), the percentage of bone marrow CD20(+)CD5(+)sIgM(+) lymphocytes, and the plasma levels of IgM, were significantly higher, at 3 months and up to 9 months, than in non responders. These IgM reacted with O-linked sugars expressed by leukemic cells and could induce tumor cell apoptosis. In responder patients the stromal-derived factor-1 and the B-lymphocyte-activating factor of the tumor necrosis factor family significantly raised in the bone marrow after imatinib administration, together with the bone morphogenetic proteins-2 and -7. All patients with high number of CD20(+)CD5(+)sIgM(+) cells and high stromal-derived factor-1 and B lymphocyte activating factor levels, underwent complete cytogenetic and/or molecular remission by 12 months. We propose that CD20(+)CD5(+)sIgM(+) lymphocytes producing anti-carbohydrate antibodies with anti-tumor activity, might contribute to the response to imatinib treatment. As in multivariate analysis bone marrow CD20(+)CD5(+)sIgM(+) cells and stromal-derived factor-1 and B-lymphocyte-activating factor levels were significantly related to cytogenetical and molecular changes, they might contribute to the definition of the pharmacological response.


Conflict of interest statement

Competing Interests: The authors have declared that no competing interests exist.

Figures

Figure 1
Figure 1. Increased CD20+CD5+sIgM+ lymphocytes and IgM plasma concentrations in the BM of CML patients upon imatinib therapy.
BM samples were drawn after 3 mo of therapy (A–D) or at the time of diagnosis (t0) (B–D). Panels A and B: cells isolated from BM were stained with the APC-conjugated anti-CD20, followed by the FITC-conjugated anti-IgM mAb, and/or the PE-conjugated anti-CD5 mAb. Samples were run on a Cyan ADP cytofluorimeter, gated on lymphocytes and to exclude non viable cells and debris, and results expressed as log far-red fluorescence intensity (a.u.) (A) vs. log green fluorescence intensity (left dot plots) or log red fluorescence intensity (right dot plots), or percentage of positive cells (B). Panel A: R (upper dot plots) and NR (lower dot plots) patient specimens at mo 3; numbers in upper left (UL) and upper right (UR) quadrants indicate CD20+sIgM (UL) or CD20+sIgM+ (UR cells (left dot plots) and CD20+CD5 (UL) or CD20+CD5+ (UR) cells (right dot plots). Panel B: BM CD20+CD5+sIgM+ cells at t0 and mo 3 in R and NR patients. Mean±SD from 32 R and 8 NR patients. * p<0.001 vs NR and t0. Panels C and D: IgM (C) and IgG (D) content was measured in BM plasma samples from R or NR patients or 10 healthy (H) donors by ELISA using a commercial kit containing specific antibodies against these Ig classes and HRP-streptavidin conjugated secondary antibodies. Following development with ABTS, plates were read at OD405, referred to a standard curve and results expressed as mg/dL. Mean±SD from 32 R and 8 NR patients. * p<0.001 vs t0; ** p<0.001 vs NR.
Figure 2
Figure 2. BM IgM from responder CML patients react with leukemic cells.
Leukemic cells (CML) from R (panels A-C) or NR (panel C) patients were used. After incubation with BM plasma and staining with FITC anti-human IgM or IgG, samples were run on a CyAn ADP cytofluorimeter, gated on leukemic cells, after exclusion of cell debris on the basis of FSC and SSC, and results expressed as log green fluorescence intensity (a.u.) vs number of cells (A and B) or as percentage of positive cells (C). Panel A: Black lines: BM plasma samples of representative R (left and right histograms) or NR (central histograms) patients, diluted 1∶10, were incubated with R CML, followed by FITC-anti-human IgM (left and central histograms) or anti-human IgG (right histogram) antisera. Numbers in each histogram: percentage and mean fluorescence intensity (arbitrary units, a.u.) of positive cells. Grey-dotted lines: CML incubated with FITC-anti-human IgM or anti-human IgG antisera alone. Panel B: CML cells from a representative R patient were untreated (grey-dotted lines) or treated (black lines) with 20 µU/mL O-glycosidase (left histogram) or 10 mU/mL N-glycosidase (central histogram) for 4 h at 37°C before incubation with autologous BM plasma followed by FITC-anti-human IgM antiserum; right histogram: CML incubated with FITC-anti-human IgM alone. Numbers in each histogram: percentage and mean fluorescence intensity (a.u.) of positive cells. Panel C: CML cells from R (black columns) or NR (white columns) patients, untreated (−) or treated (+) with O-glycosidase were incubated with BM plasma samples from R or NR patients, followed by FITC-anti-human IgM, run on a CyAn ADP as above, and results expressed as percentage of positive cells. Mean±SD from 22 R and 8 NR patients. * p<0.001 vs NR; **p<0.001 vs (−).
Figure 3
Figure 3. SDF-1, BAFF, BMP2 and BMP7 production in the BM of CML patients following imatinib therapy.
BM samples were drawn at diagnosis (t0) or 3 months (3mo) after therapy with imatinib. Panel A: SDF-1 (left histograms) or BAFF (right histograms) content was measured in BM plasma by ELISA, referred to a standard curve and results expressed as pg/mL. Mean±SD from 32 R and 8 NR patients. * p<0.001 vs t0; **p<0.001 vs NR. Panels B–D: total RNA was extracted from cells isolated from BM samples before (t0) and after (3 mo) imatinib treatment and reverse-transcribed with random primers. Q-RT-PCR was performed with primers and probes for SDF-1 (B, left histograms), BAFF (B, right histograms), BMP2 (C) and BMP7 (D) on the 7900HT FastRT-PCR system with the fluorescent Taqman method. mRNAs were normalized to 18 s as a control gene, and referred to a standard curve. Results are expressed as the fold relative increase in mRNA expression compared to the control gene. Mean±SD from 32 R and 8 NR patients. * p<0.001 vs t0; **p<0.001 vs NR.
Figure 4
Figure 4. SDF-1 and BAFF production in the BM of CML patients following in vitro exposure to imatinib.
Cells isolated from BM samples of 6 CML patients (4R and 2NR) at diagnosis (t0) were cultured in vitro for 3 to 14 days without (medium) or with 5 µM purified imatinib mesylate; cells were recovered at day 3, 5, 7 and 14. Total RNA was extracted and reverse-transcribed. Q-RT-PCR was performed with primers and probes for SDF-1 (panel A) or BAFF (panel B) on the 7900HT FastRT-PCR system with the fluorescent Taqman method. mRNAs were normalized to 18 s as a control gene, and referred to a standard curve. Results are expressed as the fold relative increase in mRNA expression compared to levels prior to imatinib in vitro treatment. Mean±SD from 4 R and 2 NR patients. * p<0.001 vs 3d; **p<0.001 vs NR. Panels C and D: SDF-1 (C) and BAFF (D) content was measured in SN of BM cells of CML patients (R, n = 4; NR, n = 2), at t0 or cultured as above and recovered on day 5 and 7, by ELISA kit, referred to standard curve and results expressed as pg/mL. Mean±SD from 4 R and 2 NR patients. * p<0.001 vs 3d; **p<0.001 vs NR.
Figure 5
Figure 5. CD20+CD5+sIgM+ lymphocytes, IgM plasma levels and SDF-1 production in the BM of CML patients during imatinib therapy.
BM samples were drawn at diagnosis (t0) or at 3, 6, 12, 18 months of therapy with imatinib. Panel A: cells isolated from BM were stained with the APC-conjugated anti-CD20, followed by FITC-conjugated anti-sIgM and by the PE-conjugated anti-CD5 mAb. Samples were run on a CyAn ADP cytofluorimeter, gated to exclude non viable cells and debris, and results expressed as percentage of positive cells. Mean±SD from 32 R and 8 NR patients. * p<0.001 vs t0; **p<0.001 vs NR. Panel B: IgM content was measured in BM plasma samples by ELISA using a specific antibody against this Ig class and HRP-streptavidin conjugated secondary antibody. Following development with ABTS, plated were read at OD405, referred to a standard curve and results expressed as mg/dL. Mean±SD from 32 R and 8 NR patients. * p<0.001 vs t0; **p<0.001 vs NR. Panel C: Total RNA was extracted from cells isolated from BM samples and reverse-transcribed with random primers. Q-RT-PCR was performed with primers and probes for SDF-1 on the 7900HT FastRT-PCR system. mRNAs were normalized to 18 s as a control gene, and referred to a standard curve. Results are expressed as the fold relative increase in mRNA expression. Mean±SD from 32 R and 8 NR patients. * p<0.001 vs t0; **p<0.001 vs NR. Panel D: SDF-1 content was measured in BM plasma by ELISA Multiplex kits, referred to a standard curve and results expressed as pg/mL. Mean±SD from 32 R and 8 NR patients. * p<0.001 vs t0; **p<0.001 vs NR.

References

    1. O'Brien S, Berman E, Borghaei H, Deangelo DJ, Devetten MP, et al. National Comprehensive Cancer Network. NCCN: clinical practice guidelines in oncology. Chronic Myelogenous Leukemia. J Natl Compr Canc. 2009;Netw.7:984–1023. - PubMed
    1. Hochhaus A, O'Brien SG, Guilhot F, Druker BJ, Branford S, et al. Six-year follow-up of patients receiving imatinib for the first-line treatment of chronic myeloid leukaemia. Leukemia. 2009;23:1054–1061. - PubMed
    1. Smyth MJ. Imatinib Mesylate – Uncovering a fast track to adaptive immunity. New Engl J Med. 2006;354:2282–2284. - PubMed
    1. Borg C, Terme M, Tajeb J, Ménard C, Flament C, et al. Novel mode of action of c-kit tyrosine kinase inhibitors leading to NK cell-dependent antitumor effects. J Clin Invest. 2004;114:379–388. - PMC - PubMed
    1. Chan CW, Crafton E, Fan HN, Flook J, Yoshimura K, et al. Interferon-producing killer dendritic cell provide a link between innate and adaptive immunity. Nature Medicine. 2006;12:207–213. - PubMed

Publication types

MeSH terms