. 2011 Apr 14;6(4):e18765.
doi: 10.1371/journal.pone.0018765.

Expression of measles virus nucleoprotein induces apoptosis and modulates diverse functional proteins in cultured mammalian cells

Affiliations

Expression of measles virus nucleoprotein induces apoptosis and modulates diverse functional proteins in cultured mammalian cells

Ashima Bhaskar et al. PLoS One. .

Abstract

Background: Measles virus nucleoprotein (N) encapsidates the viral RNA, protects it from endonucleases and forms a virus specific template for transcription and replication. It is the most abundant protein during viral infection. Its C-terminal domain is intrinsically disordered imparting it the flexibility to interact with several cellular and viral partners.

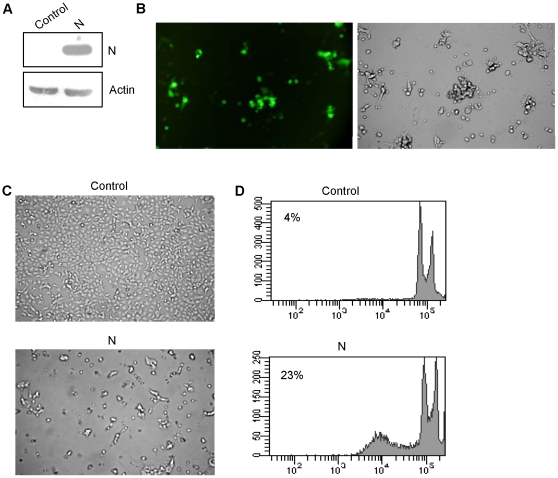
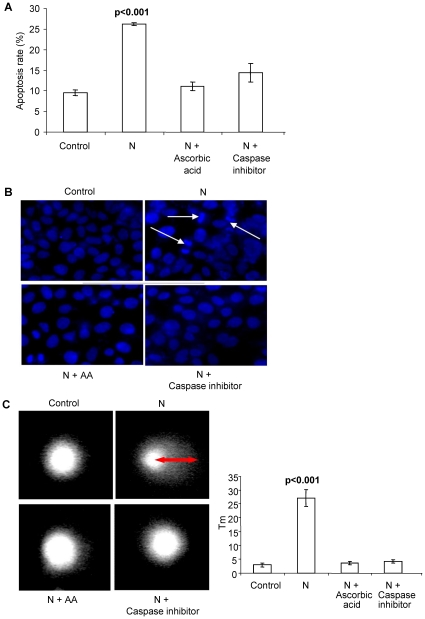
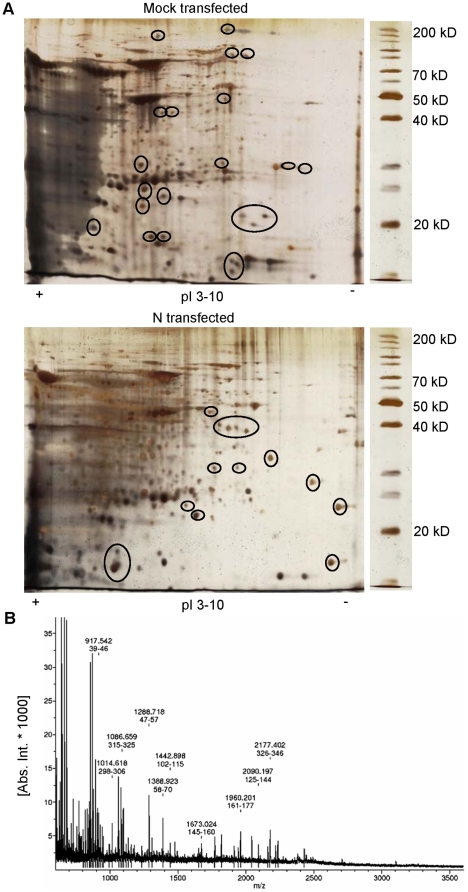
Principal findings: In this study, we demonstrate that expression of N within mammalian cells resulted in morphological transitions, nuclear condensation, DNA fragmentation and activation of Caspase 3 eventuating into apoptosis. The rapid generation of intracellular reactive oxygen species (ROS) was involved in the mechanism of cell death. Addition of ascorbic acid (AA) or inhibitor of caspase-3 in the extracellular medium partially reversed N induced apoptosis. We also studied the protein profile of cells expressing N protein. MS analysis revealed the differential expression of 25 proteins out of which 11 proteins were up regulated while 14 show signs of down regulation upon N expression. 2DE results were validated by real time and semi quantitative RT-PCR analysis.

Conclusion: These results show the pro-apoptotic effects of N indicating its possible development as an apoptogenic tool. Our 2DE results present prima facie evidence that the MV nucleoprotein interacts with or causes differential expression of a wide range of cellular factors. At this stage it is not clear as to what the adaptive response of the host cell is and what reflects a strategic modulation exerted by the virus.


Conflict of interest statement

Competing Interests: The authors have declared that no competing interests exist.

Figures

Figure 1
Figure 1. N induces cell death in MCF7 cells.
(a) Immunoblot analysis of N expression in MCF7 cells. (b) Representative fluorescent images of cells co transfected with GFP and N expression vectors showing 70–80% transfection efficiency. (c) Morphological features of MCF7 cells expressing N as seen by light microscopy. (d) Flow cytometric profile of representative cell populations 24 h post transfection, fixed and PI stained for cell cycle analysis as described in methods. The data is representative of three independent experiments.
Figure 2
Figure 2. N induces ROS production and caspase 3 activation in MCF7 and 293T cells.
(a) N and P expression in MCF-7 cells. 24 h after transfection, total RNA was extracted from the cells and RT-PCR was performed as described in methods. Gel pictures showing expression of N and P. (b) Analysis of ROS generation by DCF fluorescence as described in Methods. Representative fluorescent images and corresponding mean fluorescence intensity. (c) Determination of caspase 3 activation in MCF7 cells by FITC fluorescence as described in Methods. Results are expressed as the fold increase in fluorescence and are given as the mean ± SD for three experiments.
Figure 3
Figure 3. Inhibition of apoptosis by AA and Z-VAD-FMK.
(a) Percentage of apoptosis in control N expressing cells analyzed by flow cytometry after PI staining. Apoptotic cells were estimated by the percentage of cells in the sub-G1 peak. Each bar represents the mean ± SD of three independent experiments. (b) Nuclear staining with hoechst 33258. N transfected MCF7 cells showed apoptotic morphology; DNA condensation and nuclear fragmentation whereas rest of the cells remained uniformly stained with round and unpunctuated nucleus. White arrows indicate nuclear condensation and fragmentation. The figures represent one of the three independent experiments. (c) Single Cell Gel Electrophoresis assessment of N toxicity in human breast cancer cells (MCF7). Cells were harvested for comet tail formation assays under alkaline conditions. Comet images were captured using fluorescence microscopy, and tail moment was analyzed in 50–60 randomly chosen comets using Comet assay IV software. Representative comet images observed are shown. Histograms represent changes in the comet tail moments between control and treated cells. N transfected cells show a long tail indicating DNA damage. Each experiment was done in triplicate. Data is represented as means ±SD.
Figure 4
Figure 4. Typical 2D gel analysis of N transfected cells compared with control cells.
Cells were transfected with either pCA or pCA-N and 24 h post transfection total cellular protein was extracted. Protein extracts were subjected to separation by 2DE prior to staining and visualization as described under methods. (a) Representative 2D gels of control and treated samples. Encircled proteins were consistently seen to vary in intensity in multiple experiments. Those spots were picked for sequencing. (b) The MALDI-TOF-MS mass spectrum of a spot, identified as the Poly(rC) binding protein 1 according to the matched peaks is shown.
Figure 5
Figure 5. Validation of 2DE by real time and semi quantitative RT-PCR.
24 h after transfection, total RNA was extracted from the cells and real time and semi quantitative RT-PCR was performed as described in methods. (a) Gel pictures showing differential expression of PARK7 and PHB. Fold change in expression was analyzed by software ImageJ. Data was normalized with beta actin as the control house keeping gene. (b) Relative quantification of GAPDH and MAP2K4 mRNA in N transfected and control MCF7 cells. The change in gene expression is expressed as fold change in relation to control. Results are presented as the mean ± SD from 3 different experiments.
Figure 6
Figure 6. Protein interaction map.
Map was prepared using the STRING web tool (http://string.embl-heidelberg.de/) using default parameters and the accession for identified proteins. Different types of interactions are depicted by different colored lines. The legend of the interaction network is summarized in the figure. Numbers show the identified proteins. These proteins interact with each other as well as with some other predicted functional proteins.

References

    1. Griffin DE. Measles virus. In: Knipe DM, Howley PM, Griffin DE, Lamb RA, Martin MA, Roizman B, Straus SE, editors. Fields Virology. Philadelphia: Lippincott Williams & Wilkins 4th ed; 2001. pp. 1401–1441.
    1. Egelman EH, Wu SS, Amrein M, Portner A, Murti G. The Sendai virus nucleocapsid exists in at least four different helical states. J Virol. 1989;63:2233–2243. - PMC - PubMed
    1. Finch JT, Gibbs AJ. Observations on the structure of the nucleocapsids of some paramyxoviruses. J Gen Virol. 1970;6:141–150. - PubMed
    1. Lamb RA, Kolakofsky D. Paramyxoviridae: The viruses and their replication. In: Fields BN, Knipe DM, Howley PM, editors. Fields Virology. Philadelphia: Lippincott Williams & Wilkins 4th ed; 2001. pp. 1305–1340.
    1. Longhi S, Receveur-Brechot V, Karlin D, Johansson K, Darbon H, et al. The C-terminal domain of the measles virus nucleoprotein is intrinsically disordered and folds upon binding to the C-terminal moiety of the phosphoprotein. J Biol Chem. 2001;278:18638–18648. - PubMed

Publication types