A PiggyBac-based recessive screening method to identify pluripotency regulators
- PMID: 21533166
- PMCID: PMC3078921
- DOI: 10.1371/journal.pone.0018189
A PiggyBac-based recessive screening method to identify pluripotency regulators
Abstract
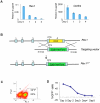
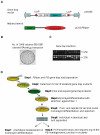
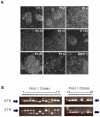
Phenotype driven genetic screens allow unbiased exploration of the genome to discover new biological regulators. Bloom syndrome gene (Blm) deficient embryonic stem (ES) cells provide an opportunity for recessive screening due to frequent loss of heterozygosity. We describe a strategy for isolating regulators of mammalian pluripotency based on conversion to homozygosity of PiggyBac gene trap insertions combined with stringent selection for differentiation resistance. From a screen of 2000 mutants we obtained a disruptive integration in the Tcf3 gene. Homozygous Tcf3 mutants showed impaired differentiation and enhanced self-renewal. This phenotype was reverted in a dosage sensitive manner by excision of one or both copies of the gene trap. These results provide new evidence confirming that Tcf3 is a potent negative regulator of pluripotency and validate a forward screening methodology to identify modulators of pluripotent stem cell biology.
Conflict of interest statement
Figures


Similar articles
-
Use of genome-wide RNAi screens to identify regulators of embryonic stem cell pluripotency and self-renewal.Methods Mol Biol. 2014;1150:163-73. doi: 10.1007/978-1-4939-0512-6_10. Methods Mol Biol. 2014. PMID: 24743997 Free PMC article.
-
myc maintains embryonic stem cell pluripotency and self-renewal.Differentiation. 2010 Jul;80(1):9-19. doi: 10.1016/j.diff.2010.05.001. Epub 2010 May 27. Differentiation. 2010. PMID: 20537458 Free PMC article.
-
Hypocapnia leads to enhanced expression of pluripotency and meso-endodermal differentiation genes in mouse embryonic stem cells.Exp Cell Res. 2014 Apr 1;322(2):389-401. doi: 10.1016/j.yexcr.2014.02.008. Epub 2014 Feb 18. Exp Cell Res. 2014. PMID: 24560741
-
Animal embryonic stem (ES) cells: self-renewal, pluripotency, transgenesis and nuclear transfer.Hum Cell. 2004 Sep;17(3):107-15. doi: 10.1111/j.1749-0774.2004.tb00026.x. Hum Cell. 2004. PMID: 15859155 Review.
-
Decoding pluripotency: Genetic screens to interrogate the acquisition, maintenance, and exit of pluripotency.Wiley Interdiscip Rev Syst Biol Med. 2020 Jan;12(1):e1464. doi: 10.1002/wsbm.1464. Epub 2019 Aug 13. Wiley Interdiscip Rev Syst Biol Med. 2020. PMID: 31407519 Free PMC article. Review.
Cited by
-
A membrane-associated β-catenin/Oct4 complex correlates with ground-state pluripotency in mouse embryonic stem cells.Development. 2013 Mar;140(6):1171-83. doi: 10.1242/dev.085654. Development. 2013. PMID: 23444350 Free PMC article.
-
TCF7L1 suppresses primitive streak gene expression to support human embryonic stem cell pluripotency.Development. 2018 Feb 23;145(4):dev161075. doi: 10.1242/dev.161075. Development. 2018. PMID: 29361574 Free PMC article.
-
Zfp281 orchestrates interconversion of pluripotent states by engaging Ehmt1 and Zic2.EMBO J. 2020 Jan 15;39(2):e102591. doi: 10.15252/embj.2019102591. Epub 2019 Nov 29. EMBO J. 2020. PMID: 31782544 Free PMC article.
-
Tracing the transitions from pluripotency to germ cell fate with CRISPR screening.Nat Commun. 2018 Oct 16;9(1):4292. doi: 10.1038/s41467-018-06230-0. Nat Commun. 2018. PMID: 30327475 Free PMC article.
-
A competitive protein interaction network buffers Oct4-mediated differentiation to promote pluripotency in embryonic stem cells.Mol Syst Biol. 2013 Oct 8;9:694. doi: 10.1038/msb.2013.49. Mol Syst Biol. 2013. PMID: 24104477 Free PMC article.
References
-
- Luo G, Santoro IM, McDaniel LD, Nishijima I, Mills M, et al. Cancer predisposition caused by elevated mitotic recombination in Bloom mice. Nat Genet. 2000;26:424–429. - PubMed
-
- Guo G, Wang W, Bradley A. Mismatch repair genes identified using genetic screens in Blm-deficient embryonic stem cells. Nature. 2004;429:891–895. - PubMed
-
- Ding S, Wu X, Li G, Han M, Zhuang Y, et al. Efficient transposition of the piggyBac (PB) transposon in mammalian cells and mice. Cell. 2005;122:473–483. - PubMed
Publication types
MeSH terms
Grants and funding
LinkOut - more resources
Full Text Sources
Other Literature Sources
Molecular Biology Databases

