. 2011 Apr 14;6(4):e18652.
doi: 10.1371/journal.pone.0018652.

Regionally specific white matter disruptions of fornix and cingulum in schizophrenia

Affiliations

Regionally specific white matter disruptions of fornix and cingulum in schizophrenia

Muhammad Farid Abdul-Rahman et al. PLoS One. .

Abstract

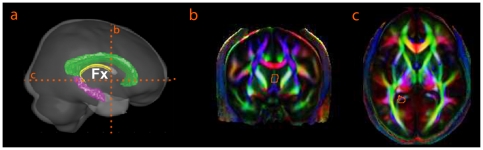
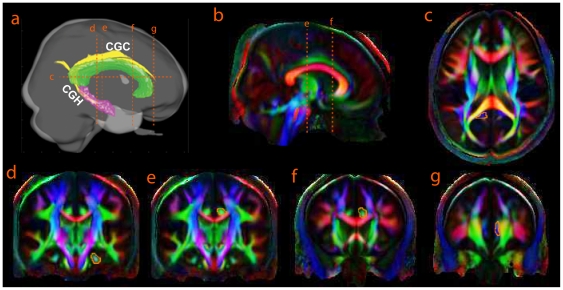
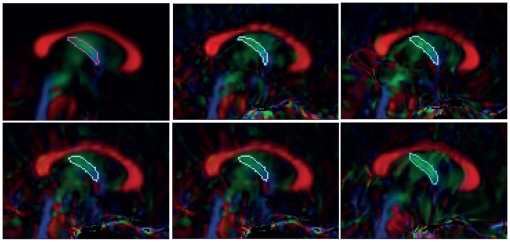
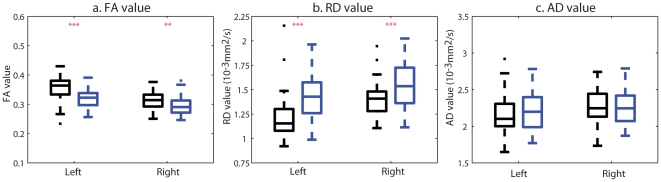
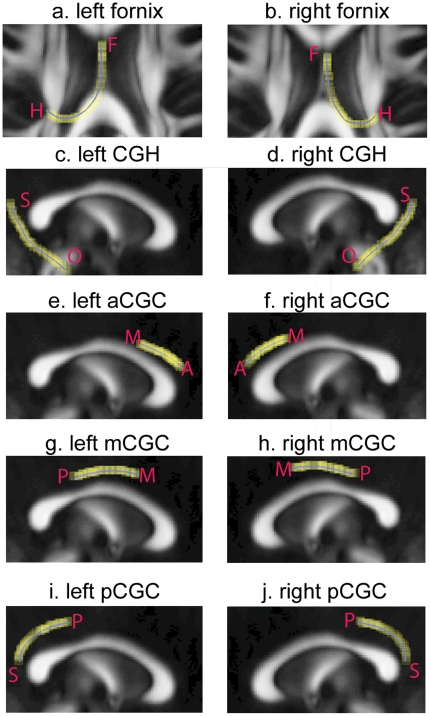
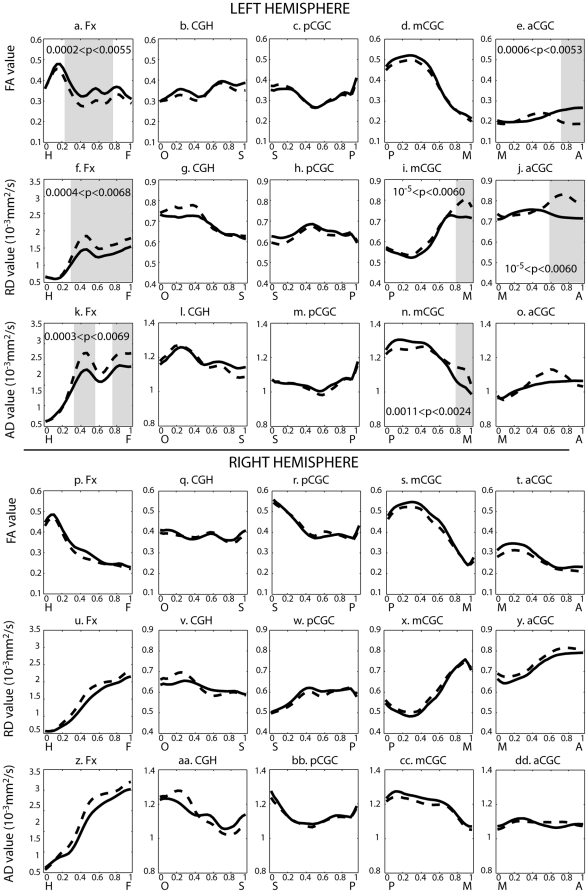
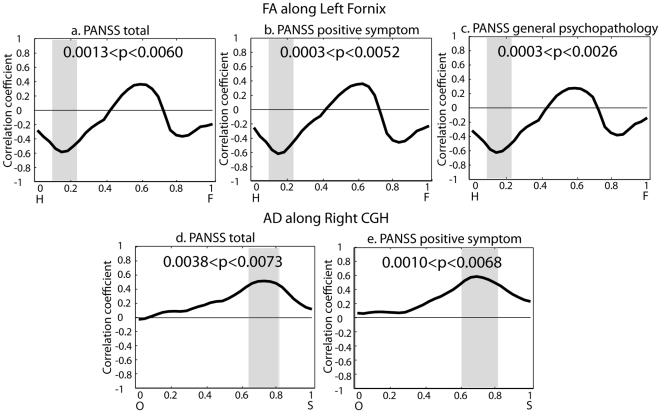
Limbic circuitry disruptions have been implicated in the psychopathology and cognitive deficits of schizophrenia, which may involve white matter disruptions of the major tracts of the limbic system, including the fornix and the cingulum. Our study aimed to investigate regionally specific abnormalities of the fornix and cingulum in schizophrenia using diffusion tensor imaging (DTI). We determined the fractional anisotropy (FA), radial diffusivity (RD), and axial diffusivity (AD) profiles along the fornix and cingulum tracts using a fibertracking technique and a brain mapping algorithm, the large deformation diffeomorphic metric mapping (LDDMM), in the DTI scans of 33 patients with schizophrenia and 31 age-, gender-, and handedness-matched healthy controls. We found that patients with schizophrenia showed reduction in FA and increase in RD in bilateral fornix, and increase in RD in left anterior cingulum when compared to healthy controls. In addition, tract-based analysis revealed specific loci of these white matter differences in schizophrenia, that is, FA reductions and AD and RD increases occur in the region of the left fornix further from the hippocampus, FA reductions and RD increases occur in the rostral portion of the left anterior cingulum, and RD and AD increases occur in the anterior segment of the left middle cingulum. In patients with schizophrenia, decreased FA in the specific loci of the left fornix and increased AD in the right cingulum adjoining the hippocampus correlated with greater severity of psychotic symptoms. These findings support precise disruptions of limbic-cortical integrity in schizophrenia and disruption of these structural networks may contribute towards the neural basis underlying the syndrome of schizophrenia and clinical symptomatology.


Conflict of interest statement

Competing Interests: The authors have declared that no competing interests exist.

Figures

Figure 1
Figure 1. Delineation of the fornix bundle (Fx).
Panel (a) illustrates the 3D view of the brain, where the fornix, hippocampus, corpus callosum are colored in yellow, pink, and green, respectively. Panels (b, c) show the coronal and axial slices of the mean DTI color map, where the ROIs are defined for delineating the fornix.
Figure 2
Figure 2. Delineation of the cingulum bundles.
They include the segment adjoining the hippocampus (CGH) and the main cingulum (CGC). Panel (a) illustrates the 3D view of the brain, where the cingulum, hippocampus, and corpus callosum are colored in yellow, pink, and green. Panels (b–g) respectively show the sagittal, axial, and coronal slices of the average DTI color map, where the ROIs are defined for delineating CGH and CGC. CGH is defined by the ROIs given in panels (c, d) whereas CGC is defined by the ROIs given in panels (c, g). CGC is further divided into three partitions using the ROIs in panels (b, e, f).
Figure 3
Figure 3. Fornix manual segmentation.
Panel (a) shows the fornix mask extracted from the averaged DTI using the fiber tracking method. Panels (b–f) show the manual masks of the fornix labeled on the DTI of five subjects.
Figure 4
Figure 4. ROI-based analysis of the fornix DTI measures.
Panels (a, b, c) respectively show the box plots of the FA, RD and AD values averaged over left and right fornix regions of interest. Black and blue boxes represent the values in the control and schizophrenia groups, respectively. Two, and three red asterisks respectively denote the p-value less than 0.05, 0.01.
Figure 5
Figure 5. ROI-based analysis of the cingulum DTI measures.
Panels (a, c, e) and (b, d, f) respectively show the box plots of the FA, RD and AD values averaged over left and right cingulum regions of interest. Black and blue boxes represent the values in the control and schizophrenia groups, respectively. One, two and three red asterisks respectively denote the p-value less than 0.1, 0.05 and 0.01. Abbreviations: CGH, cingulum adjoining the hippocampus; aCGC, anterior cingulum; mCGC, middle cingulum; pCGC, posterior cingulum.
Figure 6
Figure 6. The fornix and cingulum fiber tracts (yellow lines) and their mean curves (blue line).
Panels (a, b) respectively illustrate the left and right fornix, where “H” and “F” indicate the orientation of the fornix bundle from the hippocampus to the thalamus. Panels (c, d) respectively illustrate the left and right cingulum in the hippocampus (CGH), where “S” and “O” indicate the orientation of CGH from the splenium of the corpus callosum to the hippocampus. Panels (e–j) show the left and right cingulum in the cingulate (CGC) from the anterior, middle, to the posterior segments, where “A”, “M”, and “P” indicate the orientation of CGC from the anterior to the posterior.
Figure 7
Figure 7. Tract-based analysis of DTI measures along fornix and cingulum.
The top three rows respectively show FA, RD and AD profiles for left hemisphere, while the bottom rows show those for the right hemisphere. The panels from left to right respectively illustrate the profiles for regions of the fornix (Fx), cingulum adjoining the hippocampus (CGH), posterior cingulum (pCGC), middle cingulum (mCGC), and anterior cingulum tracts (aCGC). On each panel, solid line denotes the profile averaged over healthy controls, while dashed line denotes the profile averaged over patients with schizophrenia. The anatomical landmarks of each tract are given in Figure 6 . Regions colored by gray are the anatomical locations with significant group difference at p<0.05 after Bonferroni correction. The range of p-values is indicated on each panel.
Figure 8
Figure 8. Partial correlation analysis between DTI measures and clinical scores in left fornix and right CGH.
Panels (a–c) respectively show the correlation profile of FA values along the left fornix with PANSS total score, PANSS positive symptom score and PANSS general psychopathology score. Panels (d–e) show the correlation profile of AD values along the right CGH with PANSS total score and PANSS positive symptom score. The anatomical landmarks of each tract are given in Figure 6 . Regions colored by gray are the anatomical locations with significant group difference at p<0.05 after Bonferroni correction. The range of p-values is indicated on each panel.

Similar articles

Cited by

References

    1. Takei K, Yamasue H, Abe O, Yamada H, Inoue H, et al. Disrupted integrity of the fornix is associated with impaired memory organization in schizophrenia. Schizophrenia Research. 2008;103:52–61. - PubMed
    1. Nestor PG, Kubicki M, Spencer KM, Niznikiewicz M, McCarley RW, et al. Attentional networks and cingulum bundle in chronic schizophrenia. Schizophr Res. 2007;90:308–315. - PMC - PubMed
    1. Fujiwara H, Namiki C, Hirao K, Miyata J, Shimizu M, et al. Anterior and posterior cingulum abnormalities and their association with psychopathology in schizophrenia: A diffusion tensor imaging study. Schizophrenia Research. 2007;95:215–222. - PubMed
    1. Mufson EJ, Pandya DN. Some observations on the course and composition of the cingulum bundle in the rhesus monkey. J Comp Neurol. 1984;225:31–43. - PubMed
    1. Mori S, Oishi K, Jiang H, Jiang L, Li X, et al. Stereotaxic white matter atlas based on diffusion tensor imaging in an ICBM template. Neuroimage. 2008;40:570–582. - PMC - PubMed

Publication types