. 2011 Apr 13;6(4):e18755.
doi: 10.1371/journal.pone.0018755.

Evaluating ortholog prediction algorithms in a yeast model clade

Affiliations

Evaluating ortholog prediction algorithms in a yeast model clade

Leonidas Salichos et al. PLoS One. .

Abstract

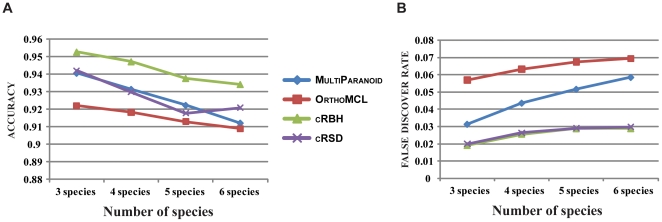
Background: Accurate identification of orthologs is crucial for evolutionary studies and for functional annotation. Several algorithms have been developed for ortholog delineation, but so far, manually curated genome-scale biological databases of orthologous genes for algorithm evaluation have been lacking. We evaluated four popular ortholog prediction algorithms (MultiParanoid; and OrthoMCL; RBH: Reciprocal Best Hit; RSD: Reciprocal Smallest Distance; the last two extended into clustering algorithms cRBH and cRSD, respectively, so that they can predict orthologs across multiple taxa) against a set of 2,723 groups of high-quality curated orthologs from 6 Saccharomycete yeasts in the Yeast Gene Order Browser.

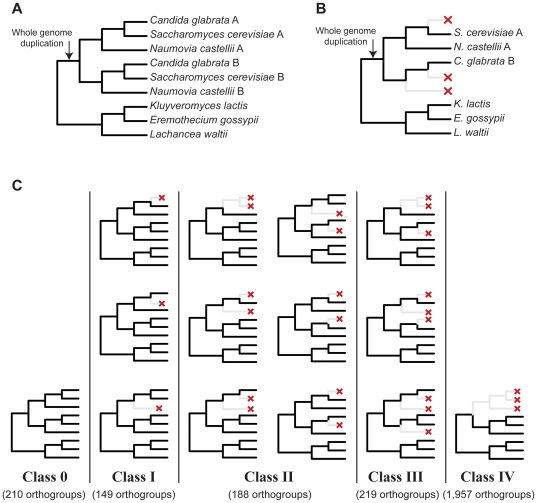
Results: Examination of sensitivity [TP/(TP+FN)], specificity [TN/(TN+FP)], and accuracy [(TP+TN)/(TP+TN+FP+FN)] across a broad parameter range showed that cRBH was the most accurate and specific algorithm, whereas OrthoMCL was the most sensitive. Evaluation of the algorithms across a varying number of species showed that cRBH had the highest accuracy and lowest false discovery rate [FP/(FP+TP)], followed by cRSD. Of the six species in our set, three descended from an ancestor that underwent whole genome duplication. Subsequent differential duplicate loss events in the three descendants resulted in distinct classes of gene loss patterns, including cases where the genes retained in the three descendants are paralogs, constituting 'traps' for ortholog prediction algorithms. We found that the false discovery rate of all algorithms dramatically increased in these traps.

Conclusions: These results suggest that simple algorithms, like cRBH, may be better ortholog predictors than more complex ones (e.g., OrthoMCL and MultiParanoid) for evolutionary and functional genomics studies where the objective is the accurate inference of single-copy orthologs (e.g., molecular phylogenetics), but that all algorithms fail to accurately predict orthologs when paralogy is rampant.


Conflict of interest statement

Competing Interests: The authors have declared that no competing interests exist.

Figures

Figure 1
Figure 1. The generation of the five distinct classes of gene loss patterns following the yeast whole genome duplication (WGD).
(A) Approximately 100 million years ago, the common ancestor of S. cerevisiae, C. glabrata, and N. castellii underwent WGD, resulting in the doubling of chromosomes. Segments that correspond to the two chromosome sets are known as tracks A and B. (B) An example of how the loss of paralogs from different tracks, if undetected, can generate an incorrect species tree. In the example, C. glabrata has lost a paralog from track A, whereas S. cerevisiae and N. castellii have lost paralogs from track B, ‘trapping’ ortholog prediction algorithms in incorrectly grouping the three post-WGD paralogs in an orthogroup. (C) In the aftermath of WGD, extensive loss of paralogs within homologous gene groups resulted in different gene loss patterns, known as classes 0 – IV . Class 0 consists of groups that have not lost any paralogs. Groups in classes I and II have lost one and two paralogs, respectively. Finally, all groups in classes III and IV have lost three paralogs, however, all paralogs lost in class IV groups were on the same track (A or B).
Figure 2
Figure 2. The pipeline used to evaluate the performance of the ortholog prediction algorithms.
The pipeline evaluates algorithm performance by comparing their predictions on six yeast proteomes against a high-quality reference set of orthologs (gold groups) constructed from the YGOB . The pipeline first compares each test group against the set of gold groups. If the test group matches with a corresponding gold group, the test group is characterized as ‘defined’ and the two groups are further compared on a gene-by-gene basis. If there is no match, the test group is characterized as ‘undefined’. For the ‘defined’ groups, genes present in both the test and the gold groups are considered true positives (TP), whereas genes present only in the test group or only in the gold group are considered as false positive (FP) and false negative (FN), respectively. From the TP, FP, and FN values for all ‘defined’ groups we then estimated the true positives (TP*), false positives (FP*), and false negatives (FN*) for the ‘undefined’ set of groups. Finally, by adding the values obtained from the analysis of ‘defined’ and ‘undefined’ groups we calculated the total number of true positive (tTP), false positive (tFP), false negative (tFN), and true negative (tTN) genes for all test groups, and used them to estimate each algorithm's sensitivity, specificity, accuracy and false discovery rate (See Methods and Text S1).
Figure 3
Figure 3. The accuracy and receiver operating characteristic (roc) curve for each ortholog prediction algorithm across a range of parameter values.
(A) The accuracy [(TP + TN)/(TP + TN + FP + FN)] of each ortholog prediction algorithm (shown on the Y-axis) is plotted against the range of algorithm-specific parameter values (shown on the X-axis). Values for MultiParanoid are for the ‘cut-off’ parameter, values for OrthoMCL are for the ‘inflation rate’ parameter, values for cRBH are for the ‘filtering parameter r’, and values for cRSD are for the ‘shape parameter a’. (B) The roc curve for each ortholog prediction algorithm shows sensitivity [TP/(TP + FN)] (on the Y-axis) plotted against 1 – specificity [1 – (TN/(TN + FP))] (on the X-axis). Optimal values and distributions reside on the top left of the graph. All values depicted in the graphs are shown in Table S1.
Figure 4
Figure 4. The accuracy and fdr of ortholog prediction algorithms using varying numbers of species.
(A) The accuracy of ortholog prediction algorithms (shown on the Y-axis) is plotted against varying numbers of species (shown on the X-axis). (B) The fdr of ortholog prediction algorithms (shown on the Y-axis) is plotted against varying numbers of species (shown on the X-axis). Each algorithm was run using the parameter value yielding the highest accuracy. All values depicted in the graphs are shown in Table S1.
Figure 5
Figure 5. The accuracy and fdr of ortholog prediction algorithms across five orthogroup classes with different gene retention patterns.
The five classes are described in Figure 1. (A) The accuracy of ortholog prediction algorithms (shown on the Y-axis) is plotted against the five classes (shown on the X-axis). (B) The fdr of ortholog prediction algorithms (shown on the Y-axis) is plotted against the five classes (shown on the X-axis). Each algorithm was run using the parameter value yielding the highest accuracy. All values depicted in the graphs are shown in Table S1.
Figure 6
Figure 6. Examples of the behavior of the four algorithms in predicting orthogroups from gold groups belonging to three different classes.
(A) Construction of gold groups (gold groups A and B) from the set of homologous gene groups from the YGOB. Each test group is evaluated against only against the gold group that had the best match. (B) The orthogroups for three different gold groups belonging to classes 0, III and IV predicted by the four different algorithms. The gold group is shown on the left-most column. The S. cerevisiae gene name for each of the three gold groups is shown on the left. Genes correctly predicted as belonging to each orthogroup (true positives) are shown in green, genes incorrectly predicted as belonging to each orthogroup (false positives) are shown in red, whereas genes present in a gold group that were not predicted to belong to this or any other test group (false negatives) are shown in grey.

References

    1. Fitch WM. Distinguishing homologous from analogous proteins. Syst Zool. 1970;19:99–113. - PubMed
    1. Koonin EV. Orthologs, paralogs, and evolutionary genomics. Annu Rev Genet. 2005;39:309–338. - PubMed
    1. Li L, Stoeckert CJ, Jr, Roos DS. OrthoMCL: identification of ortholog groups for eukaryotic genomes. Genome Res. 2003;13:2178–2189. - PMC - PubMed
    1. Bork P, Dandekar T, Diaz-Lazcoz Y, Eisenhaber F, Huynen M, et al. Predicting function: From genes to genomes and back. J Mol Biol. 1998;283:707–725. - PubMed
    1. Mirny LA, Gelfand MS. Using orthologous and paralogous proteins to identify specificity determining residues. Genome Biol. 2002;3:preprint0002.0001–0002.0020. - PubMed

Publication types

LinkOut - more resources