. 2011 Apr 13;6(4):e18641.
doi: 10.1371/journal.pone.0018641.

Diet-independent remodeling of cellular membranes precedes seasonally changing body temperature in a hibernator

Affiliations

Diet-independent remodeling of cellular membranes precedes seasonally changing body temperature in a hibernator

Walter Arnold et al. PLoS One. .

Abstract

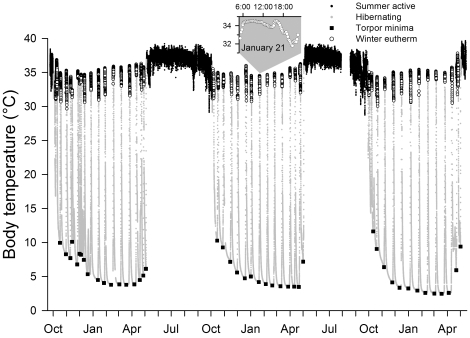
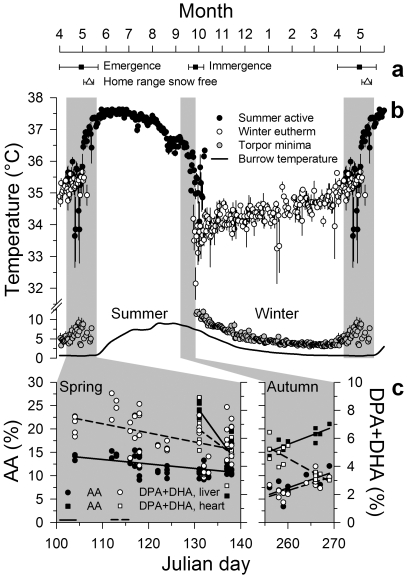
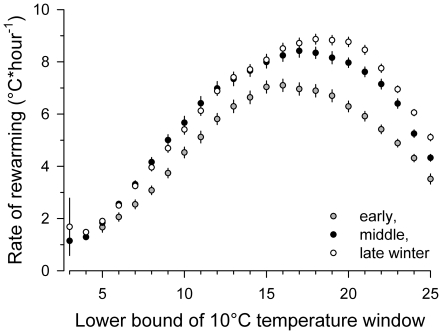
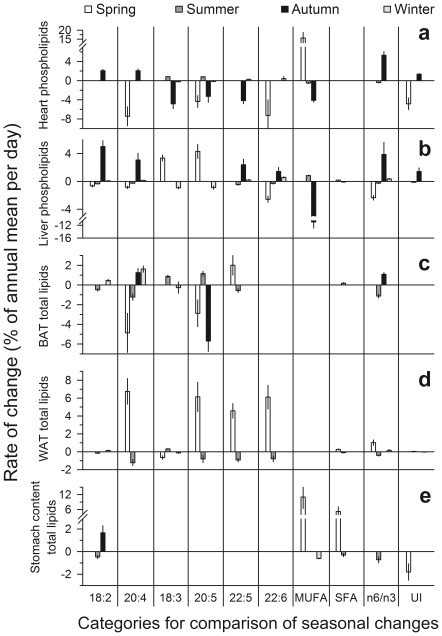
Polyunsaturated fatty acids (PUFA) have a multitude of health effects. Their incorporation into membrane phospholipids (PL) is generally believed to depend directly on dietary influx. PL influence transmembrane protein activity and thus can compensate temperature effects; e.g. PL n-6 PUFA are thought to stabilize heart function at low body temperature (T(b)), whereas long chain (>C18) n-3 PUFA may boost oxidative capacity. We found substantial remodeling of membranes in free-living alpine marmots which was largely independent of direct dietary supply. Organ PL n-6 PUFA and n-6 to n-3 ratios were highest at onset and end of hibernation after rapid increases during a brief transitional period prior to hibernation. In contrast, longer chain PL n-3 PUFA content was low at end of summer but maximal at end of hibernation. After termination of hibernation in spring, these changes in PL composition were rapidly reversed. Our results demonstrate selective trafficking of PUFA within the body, probably governed by a circannual endogenous rhythm, as hibernating marmots were in winter burrows isolated for seven months from food and external cues signaling the approaching spring. High concentrations of PL n-6 PUFA throughout hibernation are in line with their hypothesized function of boosting SERCA 2a activity at low T(b). Furthermore, we found increasing rate of rewarming from torpor during winter indicating increasing oxidative capacity that could be explained by the accumulation of long-chain PL n-3 PUFA. It may serve to minimize the time necessary for rewarming despite the increasing temperature range to be covered, because rewarming is a period of highest metabolic rate and hence production of reactive oxygen species. Considering the importance of PUFA for health our results may have important biomedical implications, as seasonal changes of T(b) and associated remodeling of membranes are not restricted to hibernators but presumably common among endothermic organisms.


Conflict of interest statement

Competing Interests: The student Ute Bruns received financial support from the Swiss Bank UBS. The authors confirm here that this does not alter their adherence to all the PLoS ONE policies on sharing data and materials, as detailed online in the guide for authors http://www.plosone.org/static/policies.action#sharing.

Figures

Figure 1
Figure 1. Analyzed body temperature parameters.
Core body temperature (Tb) course over three winters (inside a sealed hibernaculum) and two summer seasons in an adult marmot studied in its natural habitat as an example for Tb parameters and periods analyzed. Small black circles: Tb of summer active animal. Small grey circles: Tb during hibernation. Black squares: minimum Tb reached during a torpor bout. Large open circles: Tb during periods of winter euthermy defined as time between the end of continuous increase of Tb during rewarming and the onset of continuous decline of Tb into the next torpor bout (see inset for a magnified plot of a euthermy interval).
Figure 2
Figure 2. Seasonality of body temperature and membrane composition.
a Means and ranges of dates of emergence from and immergence into hibernacula (black squares and horizontal lines) of marmots equipped with transmitters; mean and range of dates when snow cover had disappeared from approximately ¾ of the marmots' home ranges as an approximation of the onset of vegetation growth (open triangles and horizontal lines). b Body temperature (Tb) of summer active (black circles), and winter euthermic (white circles) marmots, minimum Tb reached during bouts of torpor (grey circles) and burrow temperature (line). Data in a and b are double plotted for months April and May to ease visualization of the seasonal pattern. Symbols represent daily means, error bars (standard error of the mean, s.e.) reflect variation between individuals, missing error bars indicate s.e. smaller than symbol size. Burrow temperature is a line plot of daily means smoothed with a cubic spline. c Concentrations of long-chain n-6 (arachidonic acid (AA), C20:4 n-6, black symbols), and n-3 fatty acids (docosapentaenoic acid (DPA), C22:5 n-3, and docosahexaenoic acid (DHA), C22:6 n-3, white symbols) in phospholipids of liver (circles, dashed regression lines) and heart (squares, solid regression lines), of marmots shot during Spring and Autumn hunting periods (shaded sections). Data shown here are examples of several fatty acids that changed significantly (Fig. 4, Tab. 1).
Figure 3
Figure 3. Rate of rewarming and its change during winter.
Rate of rewarming from torpor to euthermy, calculated for 10°C temperature windows moving in 1°C steps from 3 to 35°C, during arousals in the early (begin to Dec 5), middle (Dec 6 to Feb 28), and late (Mar 1 to termination) third of the hibernation season. Values are means ± s.e. of moving 10°C averages. Error bars reflect variation between individuals; missing error bars indicate s.e. smaller than symbol size.
Figure 4
Figure 4. Rate of fatty acid changes.
Rates of change per day (%) during the Spring and Autumn sampling period, and in between (Summer and Winter, respectively, see Fig. 2 for definition), of concentrations of various fatty acids in heart (a) and liver phospholipids (b), in total lipids of brown adipose tissue (c), peritoneal white adipose tissue (d), and stomach content (e, only ≤C18 fatty acids analyzed), and the respective changes in n-6 to n-3 ratios and unsaturation index (UI). To ease comparisons of variables with large differences in scale, plotted values are normalized to percentage deviation from the annual mean of the respective variable. Only variables that changed significantly (p<0.05) during the respective period are plotted.

Similar articles

Cited by

References

    1. Valencak TG, Arnold W, Tataruch F, Ruf T. High content of polyunsaturated fatty acids in muscle phospholipids of a fast runner, the European brown hare (Lepus europaeus). J Comp Physiol B. 2003;173:695–702. - PubMed
    1. Soriguer FJ, Tinahones FJ, Monzón A, Pareja A, Rojo-Martínez G, et al. Varying incorporation of fatty acids into phospholipids from muscle, adipose and pancreatic exocrine tissues and thymocytes in adult rats fed with diets rich in different fatty acids. Eur J Epidem. 2000;16:585–594. - PubMed
    1. Florant GL. Lipid metabolism in hibernators: the importance of essential fatty acids. Am Zool. 1998;38:331–340.
    1. Florant GL, Amenuddin S, Rintoul DA. Dietary effects on lipid composition and metabolism. In: Romos D, Himms-Hagen J, Suzuki M, editors. Diet and Obesity. Tokyo, Japan: M. Karger; 1991. pp. 45–57.
    1. Corcoran MP, Lamon-Fava S, Fielding RA. Skeletal muscle lipid deposition and insulin resistance: effect of dietary fatty acids and exercise. Am J Clin Nutr. 2007;85:662–677. - PubMed

Publication types