. 2011 Apr 12;6(4):e18567.
doi: 10.1371/journal.pone.0018567.

A comprehensive peptidome profiling technology for the identification of early detection biomarkers for lung adenocarcinoma

Affiliations

A comprehensive peptidome profiling technology for the identification of early detection biomarkers for lung adenocarcinoma

Koji Ueda et al. PLoS One. .

Abstract

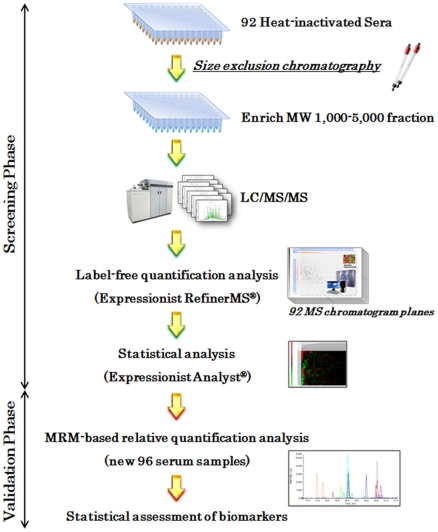
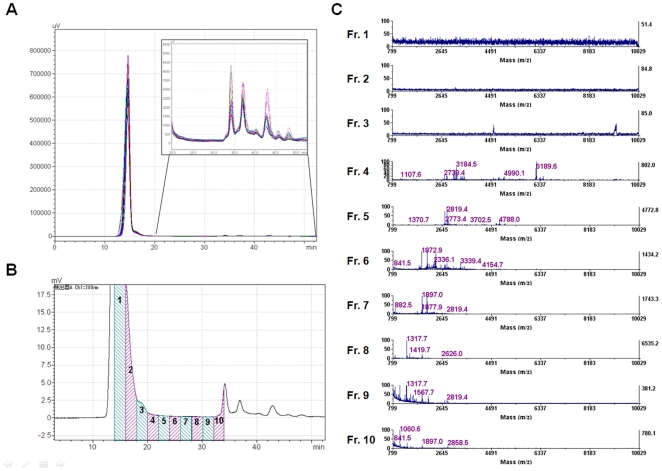
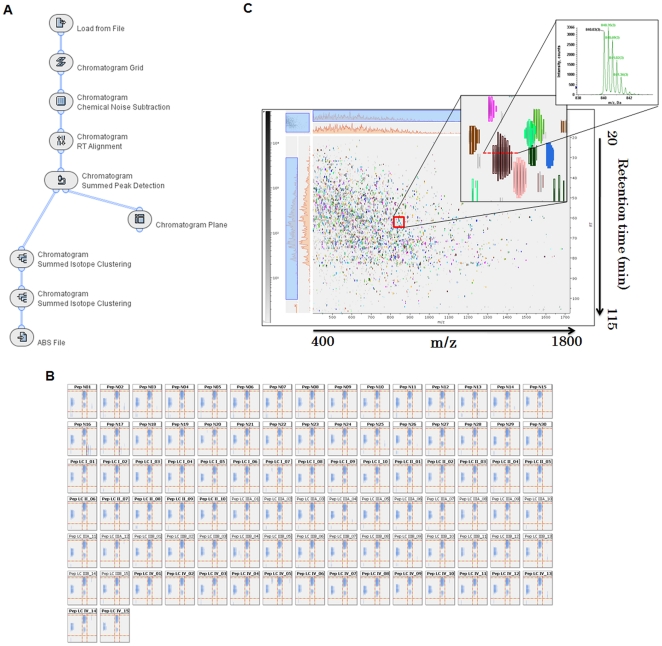
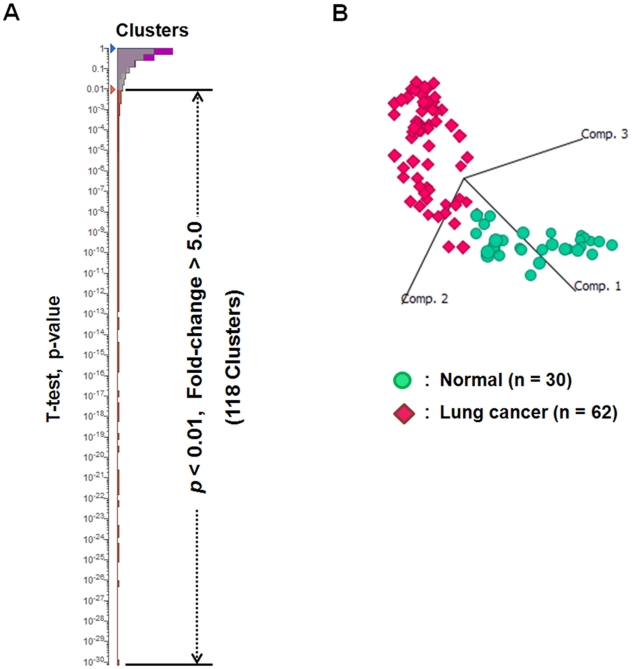
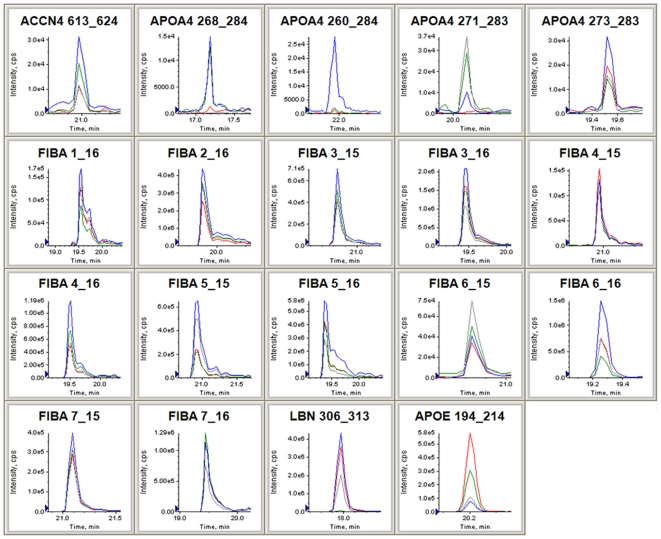
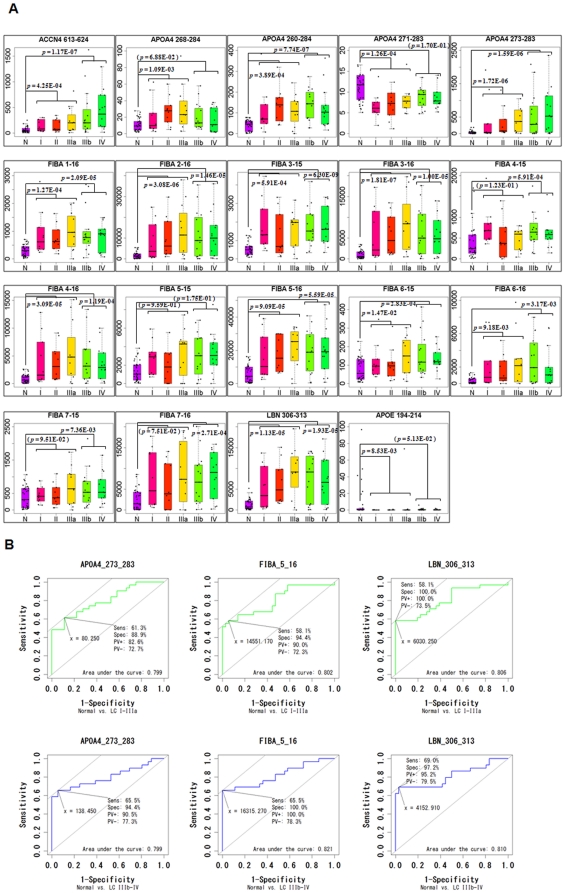
The mass spectrometry-based peptidomics approaches have proven its usefulness in several areas such as the discovery of physiologically active peptides or biomarker candidates derived from various biological fluids including blood and cerebrospinal fluid. However, to identify biomarkers that are reproducible and clinically applicable, development of a novel technology, which enables rapid, sensitive, and quantitative analysis using hundreds of clinical specimens, has been eagerly awaited. Here we report an integrative peptidomic approach for identification of lung cancer-specific serum peptide biomarkers. It is based on the one-step effective enrichment of peptidome fractions (molecular weight of 1,000-5,000) with size exclusion chromatography in combination with the precise label-free quantification analysis of nano-LC/MS/MS data set using Expressionist proteome server platform. We applied this method to 92 serum samples well-managed with our SOP (standard operating procedure) (30 healthy controls and 62 lung adenocarcinoma patients), and quantitatively assessed the detected 3,537 peptide signals. Among them, 118 peptides showed significantly altered serum levels between the control and lung cancer groups (p<0.01 and fold change >5.0). Subsequently we identified peptide sequences by MS/MS analysis and further assessed the reproducibility of Expressionist-based quantification results and their diagnostic powers by MRM-based relative-quantification analysis for 96 independently prepared serum samples and found that APOA4 273-283, FIBA 5-16, and LBN 306-313 should be clinically useful biomarkers for both early detection and tumor staging of lung cancer. Our peptidome profiling technology can provide simple, high-throughput, and reliable quantification of a large number of clinical samples, which is applicable for diverse peptidome-targeting biomarker discoveries using any types of biological specimens.


Conflict of interest statement

Competing Interests: ST is an employee of CSK Institute for Sustainability, Ltd. AT and TS are employees of Shimadzu Corporation. MN is an employee of Toppan Printing Co., Ltd. They contributed to the technical support and data analysis of this manuscript. The companies listed above also funded for this study, since this collaborative work was performed in "the academic-industrial alliance project for the development of lung cancer early detection system" among RIKEN, the University of Tokyo, Shimadzu Corporation, Toppan Printing Co., Ltd., and CSK Institute for Sustainability, Ltd. This does not alter the authors' adherence to all the PLoS ONE policies on sharing data and materials.

Figures

Figure 1
Figure 1. Schematic view of peptidome biomarker development workflow.
In the screening phase, 92 serum samples were initially heat inactivated. The peptidome fractions enriched with gel filtration chromatography were analyzed with QSTAR-Elite LC/MS/MS. Following LC/MS data processing and label-free quantification analysis on the Expressionist RefinerMS module, candidate biomarkers were statistically extracted by the Expressionist Analyst module. In the validation phase, MRM experiments were performed to assess the applicability of 19 biomarker candidates using additional 96 serum samples.
Figure 2
Figure 2. Simple and efficient enrichment of serum peptidome fractions by gel filtration chromatography.
(A) The merged display of 16 independent spectra of gel filtration chromatography (280 nm UV absorbance). 10 µl each of serum sample was loaded. The upper right box shows the magnified view of the retention time range from 20 to 50 minutes. (B)(C) To evaluate the fractionation efficacy of Superdex Peptide 10/300 column, the elute was separated into 10 fractions and analyzed with MALDI-TOF mass spectrometer. The numbers of fractions in B correspond to the spectra numbers in C.
Figure 3
Figure 3. Rapid and accurate data processing for label-free quantification on the Expressionist RefinerMS module.
(A) The total workflow used in the Expressionist RefinerMS module. Only 3 hours were needed to complete entire steps in this workflow on 92 LC/MS/MS data (each with 120 minutes LC gradient). (B) The representative area of m/z - retention time planes after RT alignment of 92 LC/MS/MS data. In each panel, three isotopic clusters and grid lines were displayed, showing highly exact alignments. (C) The MS chromatogram plane in which all data processing were completed. Finally, isotopic clusters derived from a single peptide were grouped into a colored cluster as shown in the middle panel. The far right panel shows the MS spectrum corresponding to the horizontal section view of a representative cluster.
Figure 4
Figure 4. Statistical identification of candidate biomarkers for lung cancer.
(A) The hierarchy chart of clusters (peptides) according to Student's t-test p-values (normal group vs. lung cancer group). 118 peptides satisfied the criteria of p<0.01 and fold change >5.0. (B) Principal component analysis using the values of 118 candidate biomarker peptides showed clear separation between control and lung cancer groups on the 3D plot. The proportion of variance described by the principal component 1, 2, or 3 was 66.9%, 15.0%, or 4.4%, respectively.
Figure 5
Figure 5. Selection and confirmation of the optimum MRM transitions for 19 candidates.
Four pairs of precursor m/z and fragment m/z (Q1/Q3 channels) were set as MRM transitions for each peptide. The blue, red, green, or gray MRM chromatogram monitored the fragment ion which showed the 1st, 2nd, 3rd, or 4th most intense peaks in QSTAR-Elite LC/MS/MS analysis, respectively.
Figure 6
Figure 6. Statistical assessment of MRM-based validation experiments.
(A) Box plots representing the stage-dependent distributions of serum levels of the 19 candidate biomarkers. The p-values from t-test between “normal group (n = 36) and lung cancer stage-I, II, and IIIa (n = 30)” or “normal group (n = 36) and lung cancer stage-IIIb and IV (n = 30)” are shown. The p-values that did not show significant differences were provided in parentheses. N: normal group, I, II, IIIa, IIIb, and IV: lung cancer stage-I, II, IIIa, IIIb, and IV group, respectively. (B) ROC curves for APOA4 206–284, FIBA 2–16, and LBN 306–313 were depicted by R. The green or blue graph shows comparison of “normal group (n = 36) and lung cancer stage-I, II, and IIIa (n = 30)” or “normal group (n = 36) and lung cancer stage-IIIb and IV (n = 30)”, respectively. The cut-off value was set at the point whose distance from the (sensitivity, specificity)  =  (1, 1) reached the minimum. The sensitivity (Sens), specificity (Spec), positive predictive value (PV+), negative predictive value (PV-), and area under the curve (AUC) were shown on each graph.

References

    1. Parkin DM. Global cancer statistics in the year 2000. Lancet Oncol. 2001;2:533–543. - PubMed
    1. Samet JM, Avila-Tang E, Boffetta P, Hannan LM, Olivo-Marston S, et al. Lung cancer in never smokers: clinical epidemiology and environmental risk factors. Clin Cancer Res. 2009;15:5626–5645. - PMC - PubMed
    1. Goldstraw P, Crowley J, Chansky K, Giroux DJ, Groome PA, et al. The IASLC Lung Cancer Staging Project: proposals for the revision of the TNM stage groupings in the forthcoming (seventh) edition of the TNM Classification of malignant tumours. J Thorac Oncol. 2007;2:706–714. - PubMed
    1. Henschke CI, Yankelevitz DF, Libby DM, Pasmantier MW, Smith JP, et al. Survival of patients with stage I lung cancer detected on CT screening. N Engl J Med. 2006;355:1763–1771. - PubMed
    1. Gail MH, Muenz L, McIntire KR, Radovich B, Braunstein G, et al. Multiple markers for lung cancer diagnosis: validation of models for localized lung cancer. J Natl Cancer Inst. 1988;80:97–101. - PubMed

Publication types