

Free energy simulations of a GTPase: GTP and GDP binding to archaeal initiation factor 2
- PMID: 21534562
- PMCID: PMC3097523
- DOI: 10.1021/jp201934p
Free energy simulations of a GTPase: GTP and GDP binding to archaeal initiation factor 2
Abstract
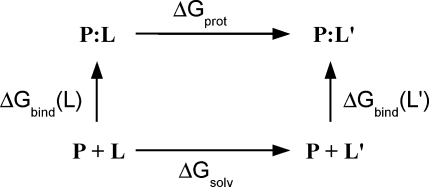
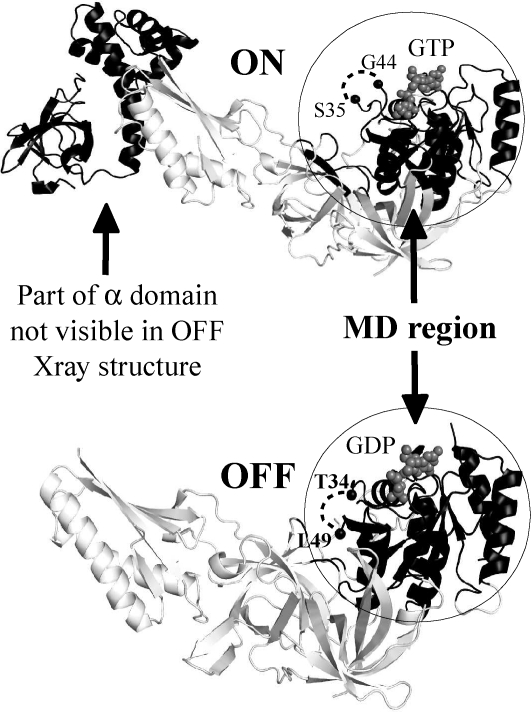
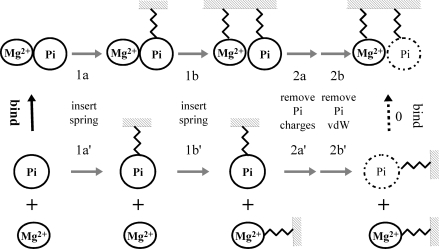
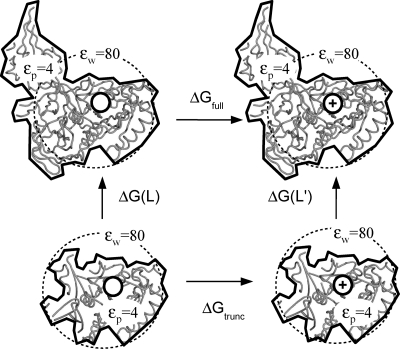
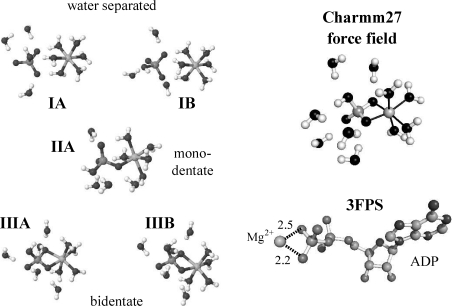
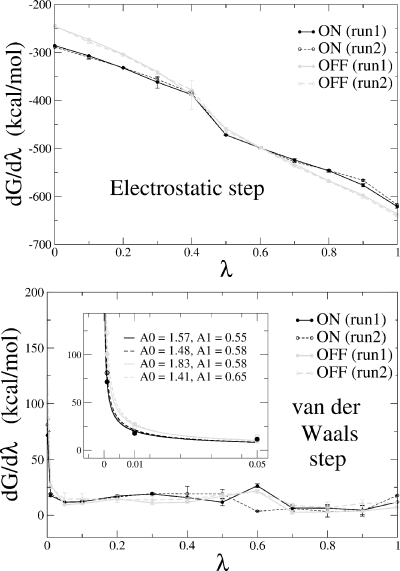
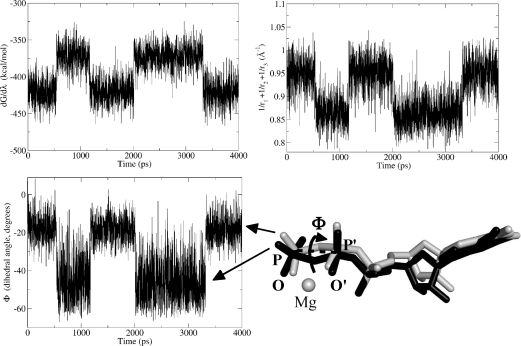
Archaeal initiation factor 2 (aIF2) is a protein involved in the initiation of protein biosynthesis. In its GTP-bound, "ON" conformation, aIF2 binds an initiator tRNA and carries it to the ribosome. In its GDP-bound, "OFF" conformation, it dissociates from tRNA. To understand the specific binding of GTP and GDP and its dependence on the ON or OFF conformational state of aIF2, molecular dynamics free energy simulations (MDFE) are a tool of choice. However, the validity of the computed free energies depends on the simulation model, including the force field and the boundary conditions, and on the extent of conformational sampling in the simulations. aIF2 and other GTPases present specific difficulties; in particular, the nucleotide ligand coordinates a divalent Mg(2+) ion, which can polarize the electronic distribution of its environment. Thus, a force field with an explicit treatment of electronic polarizability could be necessary, rather than a simpler, fixed charge force field. Here, we begin by comparing a fixed charge force field to quantum chemical calculations and experiment for Mg(2+):phosphate binding in solution, with the force field giving large errors. Next, we consider GTP and GDP bound to aIF2 and we compare two fixed charge force fields to the recent, polarizable, AMOEBA force field, extended here in a simple, approximate manner to include GTP. We focus on a quantity that approximates the free energy to change GTP into GDP. Despite the errors seen for Mg(2+):phosphate binding in solution, we observe a substantial cancellation of errors when we compare the free energy change in the protein to that in solution, or when we compare the protein ON and OFF states. Finally, we have used the fixed charge force field to perform MDFE simulations and alchemically transform GTP into GDP in the protein and in solution. With a total of about 200 ns of molecular dynamics, we obtain good convergence and a reasonable statistical uncertainty, comparable to the force field uncertainty, and somewhat lower than the predicted GTP/GDP binding free energy differences. The sign and magnitudes of the differences can thus be interpreted at a semiquantitative level, and are found to be consistent with the experimental binding preferences of ON- and OFF-aIF2.
Figures
Similar articles
-
Structure of an archaeal heterotrimeric initiation factor 2 reveals a nucleotide state between the GTP and the GDP states.Proc Natl Acad Sci U S A. 2007 Nov 20;104(47):18445-50. doi: 10.1073/pnas.0706784104. Epub 2007 Nov 13. Proc Natl Acad Sci U S A. 2007. PMID: 18000047 Free PMC article.
-
Electrostatic free energies in translational GTPases: Classic allostery and the rest.Biochim Biophys Acta. 2015 May;1850(5):1006-1016. doi: 10.1016/j.bbagen.2014.07.006. Epub 2014 Jul 15. Biochim Biophys Acta. 2015. PMID: 25047891 Review.
-
Conformational selection through electrostatics: Free energy simulations of GTP and GDP binding to archaeal initiation factor 2.Proteins. 2012 May;80(5):1264-82. doi: 10.1002/prot.24023. Epub 2012 Feb 10. Proteins. 2012. PMID: 22275120
-
Nucleotide recognition by the initiation factor aIF5B: free energy simulations of a neoclassical GTPase.Proteins. 2012 Dec;80(12):2742-57. doi: 10.1002/prot.24158. Epub 2012 Sep 15. Proteins. 2012. PMID: 22887821
-
Molecular dynamics simulations for the structure-based drug design: targeting small-GTPases proteins.Expert Opin Drug Discov. 2024 Oct;19(10):1259-1279. doi: 10.1080/17460441.2024.2387856. Epub 2024 Aug 6. Expert Opin Drug Discov. 2024. PMID: 39105536 Review.
Cited by
-
Allosteric response and substrate sensitivity in peptide binding of the signal recognition particle.J Biol Chem. 2014 Oct 31;289(44):30868-30879. doi: 10.1074/jbc.M114.584912. Epub 2014 Sep 18. J Biol Chem. 2014. PMID: 25237192 Free PMC article.
-
Computation of relative binding free energy for an inhibitor and its analogs binding with Erk kinase using thermodynamic integration MD simulation.J Comput Aided Mol Des. 2012 Oct;26(10):1159-69. doi: 10.1007/s10822-012-9606-6. Epub 2012 Sep 18. J Comput Aided Mol Des. 2012. PMID: 22986633
-
Classical Drude Polarizable Force Field Model for Methyl Phosphate and Its Interactions with Mg2.J Phys Chem A. 2018 Jul 26;122(29):6147-6155. doi: 10.1021/acs.jpca.8b04418. Epub 2018 Jul 18. J Phys Chem A. 2018. PMID: 29966419 Free PMC article.
-
Absolute and Relative Binding Free Energy Calculations of Nucleotides to Multiple Protein Classes.J Chem Theory Comput. 2025 Feb 25;21(4):2067-2078. doi: 10.1021/acs.jctc.4c01440. Epub 2024 Dec 19. J Chem Theory Comput. 2025. PMID: 39699110 Free PMC article.
-
Energetics of Preferential Binding of Retinoic Acid-Inducible Gene-I to Double-Stranded Viral RNAs with 5' Tri-/Diphosphate over 5' Monophosphate.ACS Omega. 2018 Apr 30;3(4):3786-3795. doi: 10.1021/acsomega.7b02019. Epub 2018 Apr 3. ACS Omega. 2018. PMID: 30023880 Free PMC article.
References
MeSH terms
Substances
LinkOut - more resources
Full Text Sources
Miscellaneous
