Review
. 2011 Apr:1225:59-71.
doi: 10.1111/j.1749-6632.2011.06011.x.

The von Economo neurons in the frontoinsular and anterior cingulate cortex

Affiliations
Review

The von Economo neurons in the frontoinsular and anterior cingulate cortex

John M Allman et al. Ann N Y Acad Sci. 2011 Apr.

Abstract

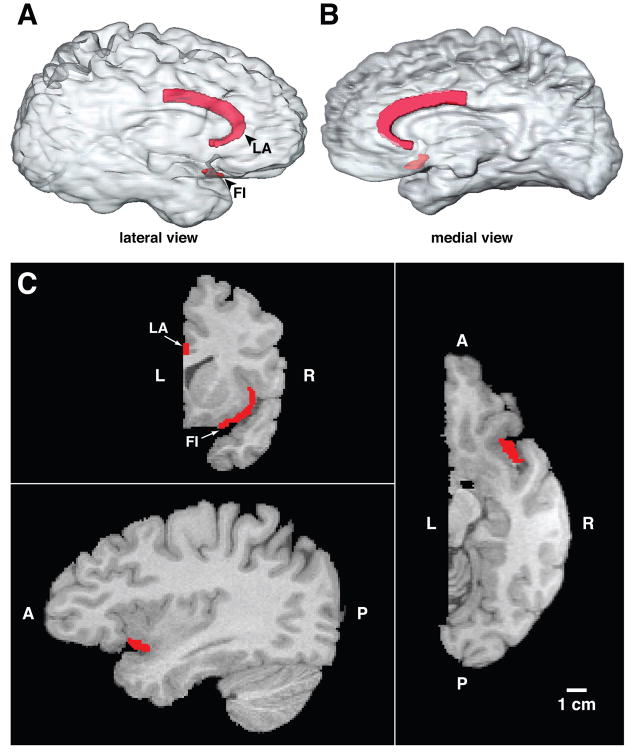
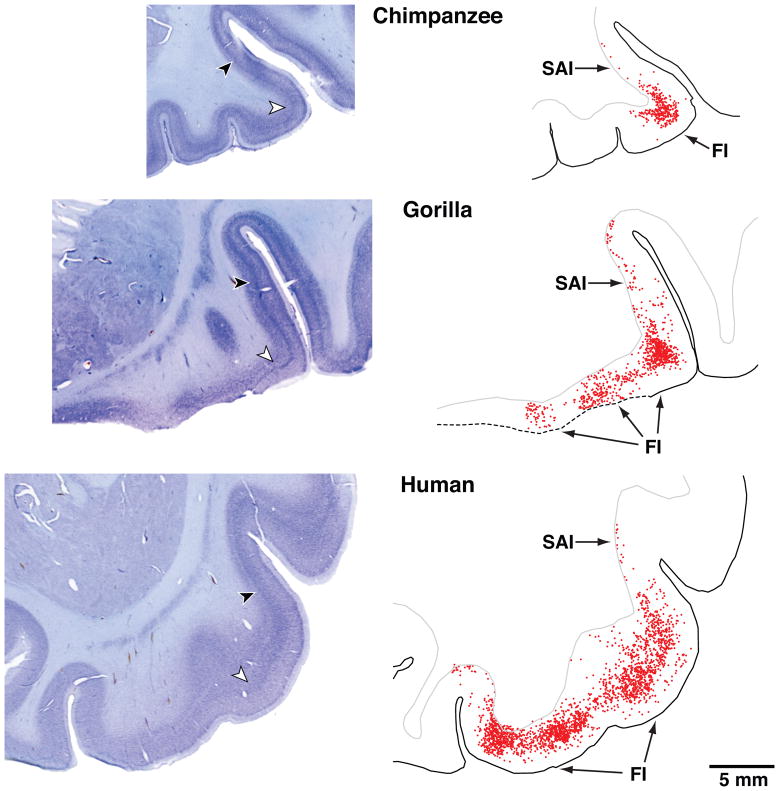
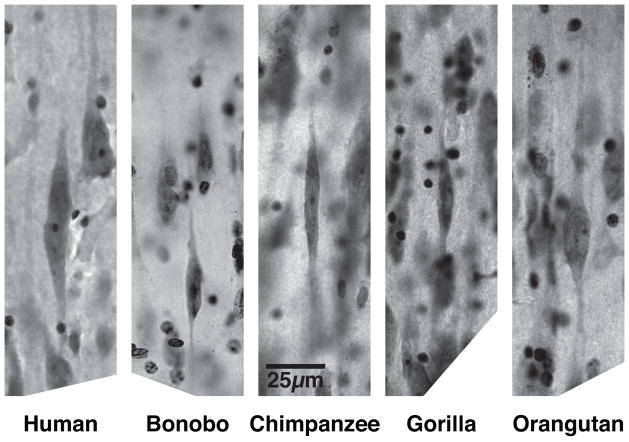
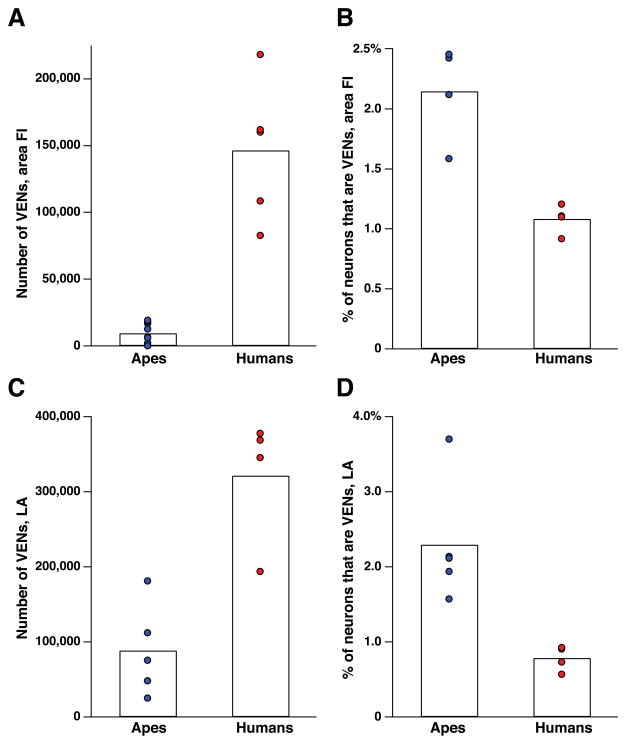
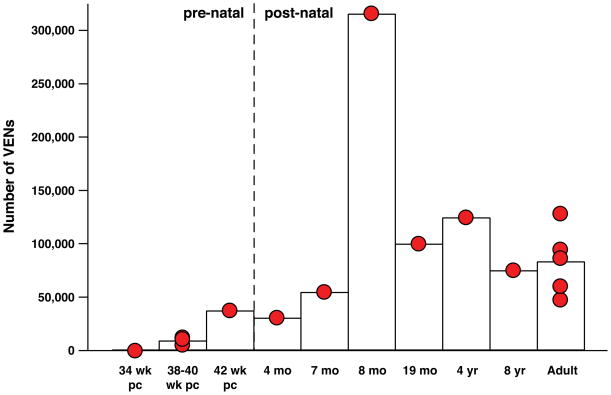
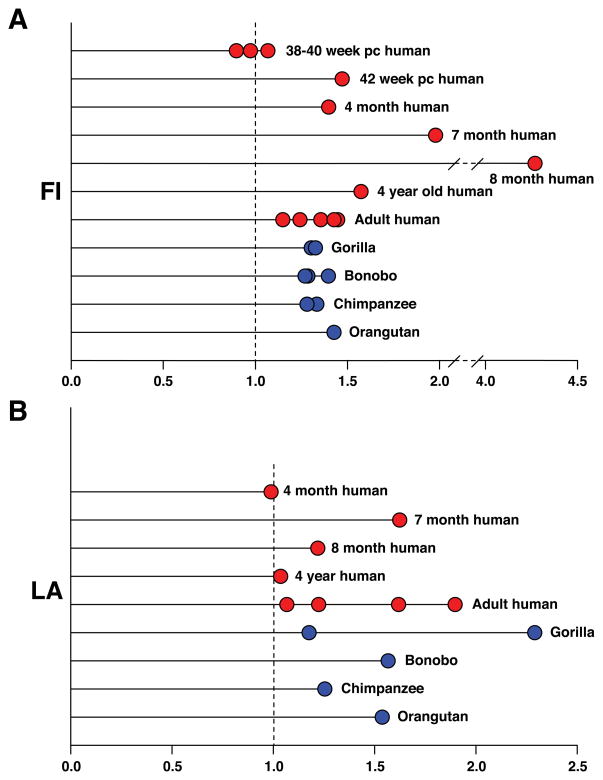
The von Economo neurons (VENs) are large bipolar neurons located in the frontoinsular cortex (FI) and limbic anterior (LA) area in great apes and humans but not in other primates. Our stereological counts of VENs in FI and LA show them to be more numerous in humans than in apes. In humans, small numbers of VENs appear the 36th week postconception, with numbers increasing during the first 8 months after birth. There are significantly more VENs in the right hemisphere in postnatal brains; this may be related to asymmetries in the autonomic nervous system. VENs are also present in elephants and whales and may be a specialization related to very large brain size. The large size and simple dendritic structure of these projection neurons suggest that they rapidly send basic information from FI and LA to other parts of the brain, while slower neighboring pyramids send more detailed information. Selective destruction of VENs in early stages of frontotemporal dementia (FTD) implies that they are involved in empathy, social awareness, and self-control, consistent with evidence from functional imaging.


Figures

Figure 1
Figure 1
Figure 2
Figure 2
Photomicrographs of frontal sections through area FI in a 39-year-old male chimpanzee, a 27-year-old male gorilla, and a 1.6-year-old male human. On the right side are outlines of the corresponding sections in which the location of each VEN has been plotted. There are 354 VENs plotted in the chimpanzee, 919 in the gorilla, and 2415 in the human plotted by scanning through the different depth planes with a 40X oil immersion lens with the aid of Stereoinvestigator software. The sections were 100 micra thick. All images are represented at the same scale. The sections are from FI on the right side except for the gorilla, in which FI was damaged during histological processing and instead the left FI has been used and the image reversed for ease of comparison with the other cases. The locations of the higher magnification photomicrographs shown in Figure 4 are indicated by arrows in the low power photomicrographs. The section illustrated for the gorilla corresponds approximately to Figure 12B, which shows the location of the seed voxels for the tractography done in the same individual. FI, fronto-insular cortex; SAI, superior insular cortex.
Figure 3
Figure 3
VENs in area FI of humans and great apes. Photomicrographs are of Nissl-stained sections. All panels share the scale indicated in the central panel.
Figure 4
Figure 4
A comparison of the number and proportion of VENs in area FI and ACC of adult humans and great apes. (See Tables 2 and 3 for data.) Bars indicate the average of all data points in a given column. (A) The number of VENs in area FI (both hemispheres combined). FI contains many more VENs in humans than in great apes (P = 0.001). (B) The percentage of neurons in area FI that are VENs. Although the great apes have a smaller total number of VENs in FI, the have a higher proportion of VENs to non-VEN neurons in FI (P = 0.029). (C) The number of VENs in ACC (both hemispheres combined). As in area FI, humans have more VENs than the great apes (P = 0.016), although this difference is less great in ACC. (D) The percentage of neurons in ACC that are VENs. Again, as in FI, the great apes have a higher percentage of neurons that are VENs (P = 0.016). All comparisons are Mann–Whitney U tests.
Figure 5
Figure 5
The number of VENs increases after birth. The number of VENs in right hemisphere FI in humans of different ages. VEN numbers are low in neonates and increase after birth. The eight-month-old individual examined had markedly more VENs in the right hemisphere than any other subject in this study; this might possibly be due to individual variation. The right hemisphere VEN measurement in this individual was repeated with similar results (see Table 2). The difference between the number of VENs in right FI for pre- and post-natal subjects was statistically significant (P = 0.0029), and this significance remained when the eight-month-old individual was removed from the comparison (P = 0.0040). The number of VENS in left FI and in both hemispheres together was also significantly different for pre- and post-natal individuals (P = 0.0056 for both). Significance was determined using the Mann–Whitney U test.
Figure 6
Figure 6
The ratio of the number of VENs in the right hemisphere to the number of VENs in the left hemisphere. (A) In postnatal humans and great apes, there are consistently more VENs in FI on the right side. This ratio develops after birth. In neonates, the numbers in each hemisphere are almost even, while in infants, juveniles, and adults there are many more VENs in the right hemisphere. When the numbers of VENs in the right and left hemispheres were compared for FI in the postnatal cases, the difference was statistically significant both with and without the eight-month-old outlier (P = 0.0039 for all postnatal humans and P = 0.0078 without the eight-month-old case). For postnatal apes and humans combined, the hemispheric difference for FI was significant at P < 0.0001. (B) The ratio of VENs in right and left LA. This ratio is less consistent than in area FI, but in almost all cases there are more VENs on the right side. When the number of VENs in the right and left hemispheres in postnatal humans was compared for LA, the result was statistically significant (P = 0.03). When postnatal apes and humans were combined, the difference was significant at P = 0.001. Significance was determined using the Mann–Whitney U test.

References

    1. von Economo C, Koskinas G. Die cytoarchitectonik der hirnrinde des erwachsenen menschen. Berlin: Springer; 1925.
    1. von Economo C. In: Cellular structure of the human cerebral cortex. Triarhou LC, translator. Basel: Karger; 2009.
    1. von Economo C. Eine neue Art Spezialzellen des Lobus cinguli und Lobus insulae. Zschr ges Neurol Psychiat. 1926;100:706–712.
    1. Seeley W, Craig A, Hof P, Merkle F, Gaus S, Allman J. Distinctive neurons in anterior cingulated and frontoinsular cortex: a historical perspective. Cereb Cortex. 2011 to be published in April 2011. - PubMed
    1. Betz W. Ueber die feinere Structur der Gehirnrinde des Menschen. Zentralbl Med Wiss. 1881;19:193–195. 209–213, 231–234.

Publication types