

Proliferation of germ cells and somatic cells in first trimester human embryonic gonads as indicated by S and S+G2+M phase fractions
- PMID: 21535263
- PMCID: PMC6496689
- DOI: 10.1111/j.1365-2184.2011.00748.x
Proliferation of germ cells and somatic cells in first trimester human embryonic gonads as indicated by S and S+G2+M phase fractions
Abstract
Objectives: The number of germ cells and somatic cells in human embryonic and foetal gonads has previously been estimated by stereological methods, which are time- and labour-consuming with little information concerning cell proliferation. Here, we studied whether flow cytometry could be applied as an easier method, also enabling estimation of the fraction of cells in S or S+G(2)+M (SG(2) M) cell-cycle phases as indicators of cell proliferation.
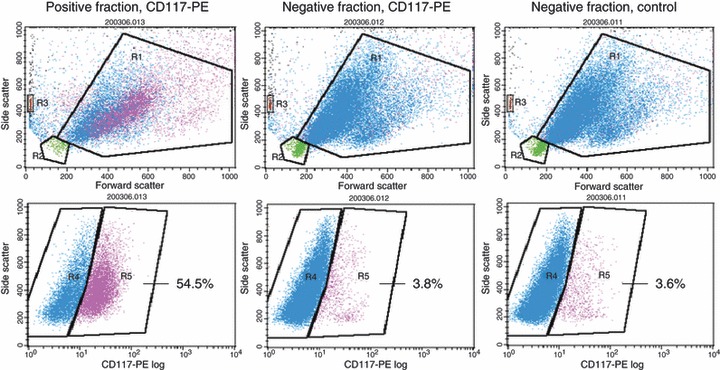
Methods: Cell suspensions from 35 human embryonic gonads at days 37 to 68 post-conception (pc) were immunomagnetically sorted into C-KIT positive (germ) cells and negative (somatic) cells. They were stained for DNA content and analysed by flow cytometry. S and SG(2) M fractions could be measured for 13 of the female and 20 of the male gonads. The number of cells was estimated using fluorescent reference beads.
Results: During the period from 37 to 68 days pc, female germ and somatic cells had a stable S and SG(2) M fractions indicating steady growth of both subpopulations, whereas they decreased in both male germ and somatic cells. The number of germ and somatic cells estimated by flow cytometry was significantly lower than in stereological estimates, suggesting loss of cells during preparation.
Conclusions: Cell proliferation as indicated by S and SG(2) M fractions could be estimated specifically for primordial germ and somatic cells. Estimation of total number of germ and somatic cells was not feasible.
© 2011 Blackwell Publishing Ltd.
Figures


Similar articles
-
Germ cell numbers in human embryonic and fetal gonads during the first two trimesters of pregnancy: analysis of six published studies.Hum Reprod. 2011 Aug;26(8):2140-5. doi: 10.1093/humrep/der149. Epub 2011 May 18. Hum Reprod. 2011. PMID: 21593044
-
Isolation of chicken primordial germ cells using fluorescence-activated cell sorting.Poult Sci. 2005 Apr;84(4):594-600. doi: 10.1093/ps/84.4.594. Poult Sci. 2005. PMID: 15844816
-
Fluorescence activated cell sorting of live female germ cells and somatic cells of the mouse fetal gonad based on forward and side scattering.Cytometry A. 2009 Jun;75(6):547-53. doi: 10.1002/cyto.a.20729. Cytometry A. 2009. PMID: 19405115
-
Experimental approaches to the study of primordial germ cell lineage and proliferation.Hum Reprod Update. 2004 May-Jun;10(3):197-206. doi: 10.1093/humupd/dmh020. Hum Reprod Update. 2004. PMID: 15140867 Review.
-
Cross talk between germ cells and gonadal somatic cells is critical for sex differentiation of the gonads in the teleost fish, medaka (Oryzias latipes).Dev Growth Differ. 2008 May;50(4):273-8. doi: 10.1111/j.1440-169X.2008.01015.x. Dev Growth Differ. 2008. PMID: 18366386 Review.
Cited by
-
Deciphering Sex-Specific Differentiation of Human Fetal Gonads: Insight From Experimental Models.Front Cell Dev Biol. 2022 Jun 2;10:902082. doi: 10.3389/fcell.2022.902082. eCollection 2022. Front Cell Dev Biol. 2022. PMID: 35721511 Free PMC article. Review.
References
-
- Byskov AG, Høyer PE (1994) Embryology of mammalian gonads and ducts In: Knobil E, Neill JD, eds. The Physiology of Reproduction, pp. 487–540. New York, USA: Raven Press.
-
- Møllgård K, Jespersen A, Lutterodt MC, Andersen CY, Høyer PE, Byskov AG (2010) Human primordial germ cells migrate along nerve fibers and Schwann cells from the dorsal hind gut mesentery to the gonadal ridge. Mol. Hum. Reprod. 16, 621–31. - PubMed
-
- Byskov AG (1986) Differentiation of mammalian embryonic gonad. Physiol. Rev. 66, 71–117. - PubMed
-
- Hilscher W (1991) The genetic control and germ cell kinetics of the female and male germ line in mammals including man. Hum. Reprod. 6, 1416–25. - PubMed
-
- Motta PM, Makabe S, Nottola SA (1997) The ultrastructure of human reproduction. I. The natural history of the female germ cell: origin, migration and differentiation inside the developing ovary. Hum. Reprod. Update 3, 281–95. - PubMed
Publication types
MeSH terms
Substances
LinkOut - more resources
Full Text Sources
