

A novel approach to dual excitation ratiometric optical mapping of cardiac action potentials with di-4-ANEPPS using pulsed LED excitation
- PMID: 21536528
- PMCID: PMC3182506
- DOI: 10.1109/TBME.2011.2148719
A novel approach to dual excitation ratiometric optical mapping of cardiac action potentials with di-4-ANEPPS using pulsed LED excitation
Abstract
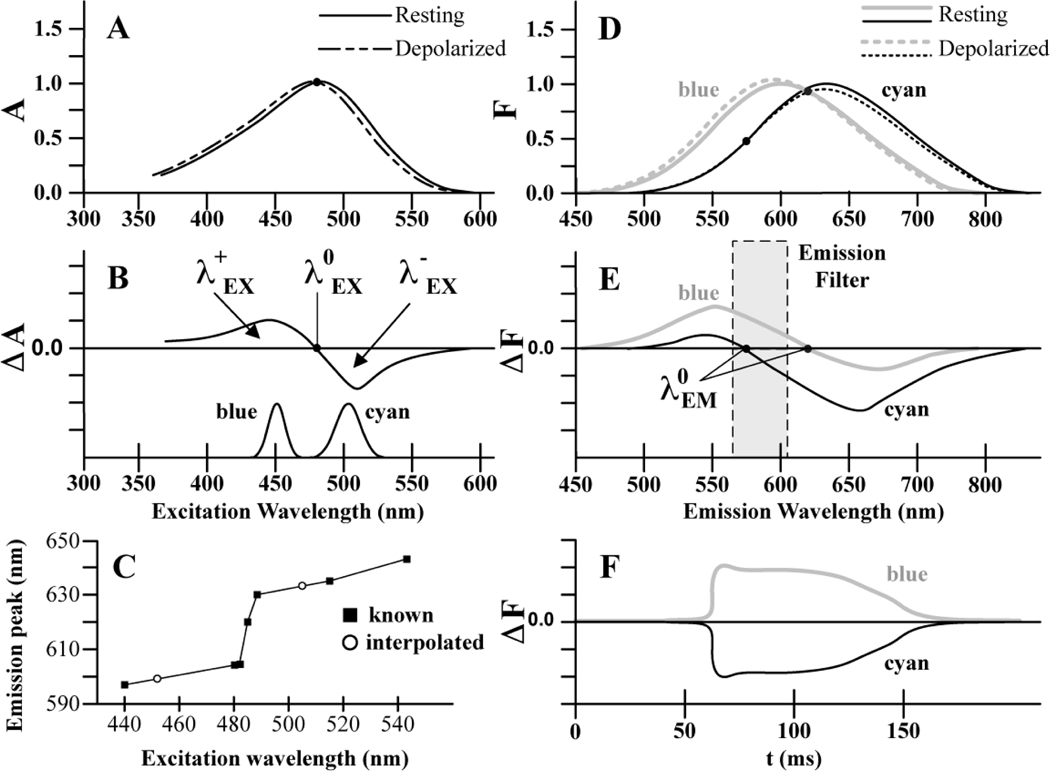
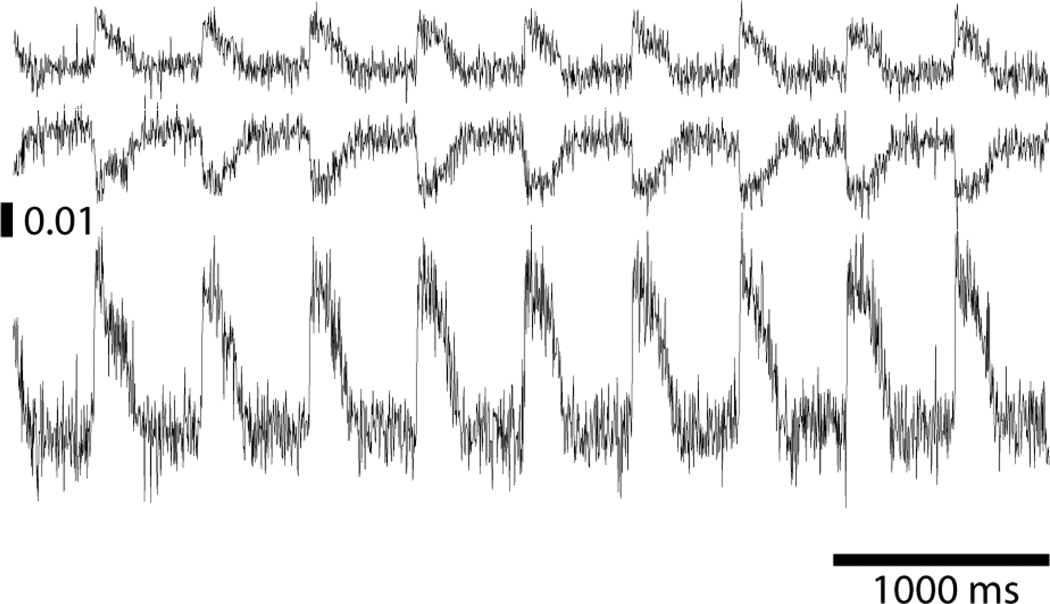
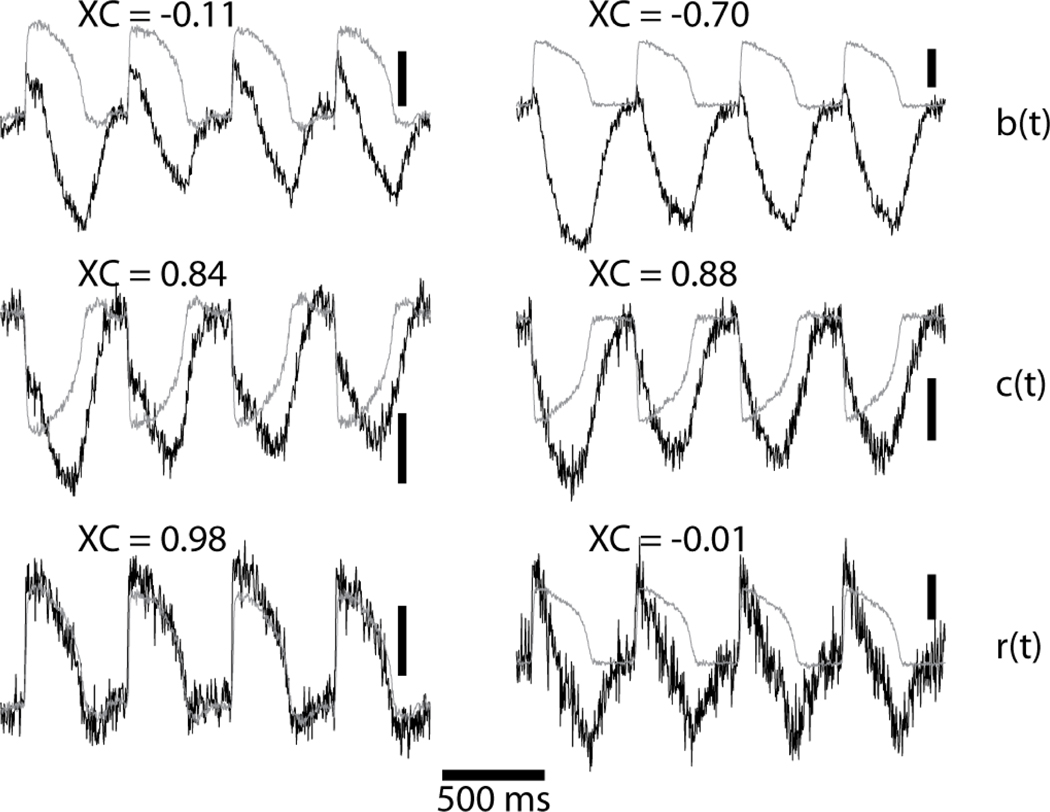
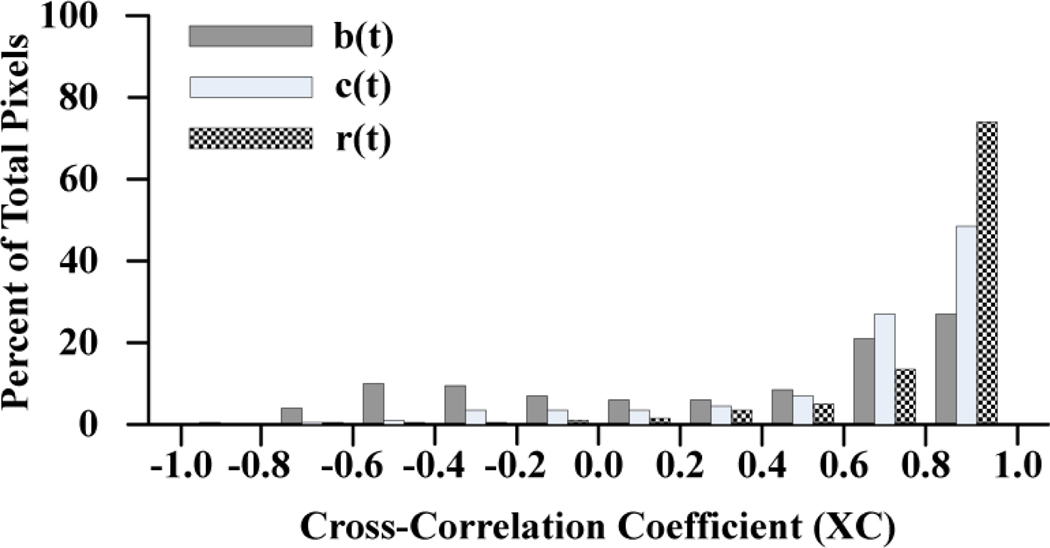
We developed a new method for ratiometric optical mapping of transmembrane potential (V(m)) in cardiac preparations stained with di-4-ANEPPS. V(m)-dependent shifts of excitation and emission spectra establish two excitation bands (<481 and >481 nm) that produce fluorescence changes of opposite polarity within a single emission band (575-620 nm). The ratio of these positive and negative fluorescence signals (excitation ratiometry) increases V(m) sensitivity and removes artifacts common to both signals. We pulsed blue (450 ± 10 nm) and cyan (505 ± 15 nm) light emitting diodes (LEDs) at 375 Hz in alternating phase synchronized to a camera (750 frames-per-second). Fluorescence was bandpass filtered (585 ± 20 nm). This produced signals with upright (blue) and inverted (cyan) action potentials (APs) interleaved in sequential frames. In four whole swine hearts with motion chemically arrested, fractional fluorescence for blue, cyan, and ratio signals was 1.2 ± 0.3%, 1.2 ± 0.3%, and 2.4 ± 0.6%, respectively. Signal-to-noise ratios were 4.3 ± 1.4, 4.0 ± 1.2, and 5.8 ± 1.9, respectively. After washing out the electromechanical uncoupling agent, we characterized motion artifact by cross-correlating blue, cyan, and ratio signals with a signal with normal AP morphology. Ratiometry improved cross-correlation coefficients from 0.50 ± 0.48 to 0.81 ± 0.25, but did not cancel all motion artifacts. These findings demonstrate the feasibility of pulsed LED excitation ratiometry in myocardium.
© 2011 IEEE
Figures
References
-
- Efimov IR, Huang DT, Rendt JM, Salama G. Optical mapping of repolarization and refractoriness from intact hearts. Circulation. 1994;vol. 90:1469–1480. - PubMed
-
- Brandes R, Figueredo VM, Camacho SA, Massie BM, Weiner MW. Suppression of motion artifacts in fluorescence spectroscopy of perfused hearts. Am J Physiol Heart Circ Physiol. 1992;vol. 263:H972–H980. - PubMed
-
- Tai DC-S, Caldwell BJ, LeGrice IJ, Hooks DA, Pullan AJ, Smaill BH. Correction of motion artifact in transmembrane voltage-sensitive fluorescent dye emission in hearts. American Journal of Physiology - Heart and Circulatory Physiology. 2004;vol. 287:H985–H993. - PubMed
-
- Fukano T, Shimozono S, Miyawaki A. Fast dual-excitation ratiometry with light-emitting diodes and high-speed liquid crystal shutters. Biochemical and Biophysical Research Communications. 2006;vol. 340:250–255. - PubMed
-
- Hoger U, Torkkeli PH, French AS. Ratiometric calcium concentration estimation using LED excitation during mechanotransduction in single sensory neurons. Journal of Neuroscience Methods. 2007;vol. 164:255–260. - PubMed
Publication types
MeSH terms
Substances
Grants and funding
LinkOut - more resources
Full Text Sources
Miscellaneous
