Comparative Study
. 2011 Jul 15;20(14):2846-60.
doi: 10.1093/hmg/ddr195. Epub 2011 May 2.

HD CAG-correlated gene expression changes support a simple dominant gain of function

Affiliations
Comparative Study

HD CAG-correlated gene expression changes support a simple dominant gain of function

Jessie C Jacobsen et al. Hum Mol Genet. .

Abstract

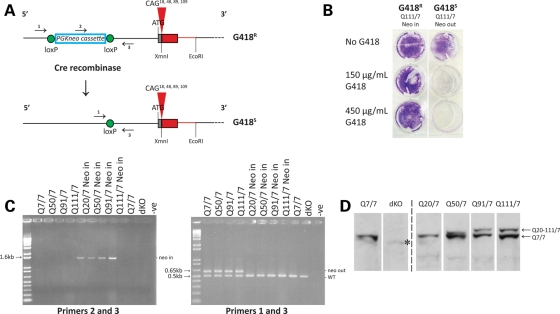
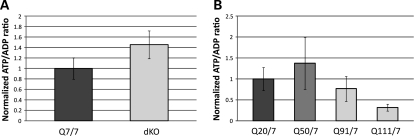
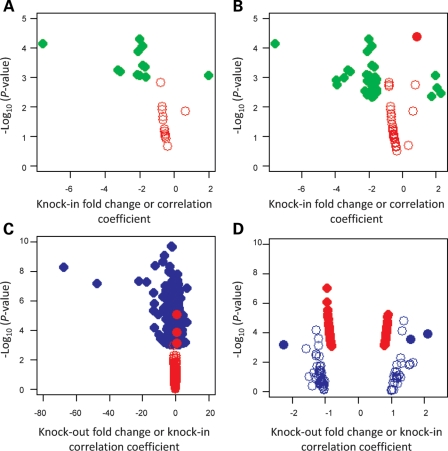
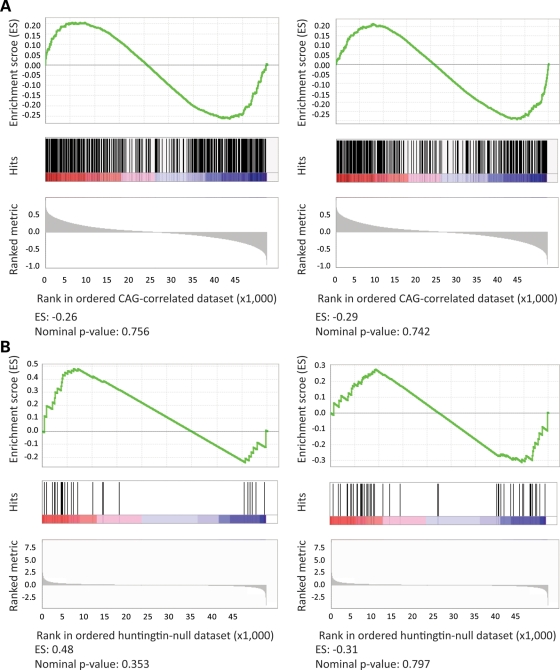
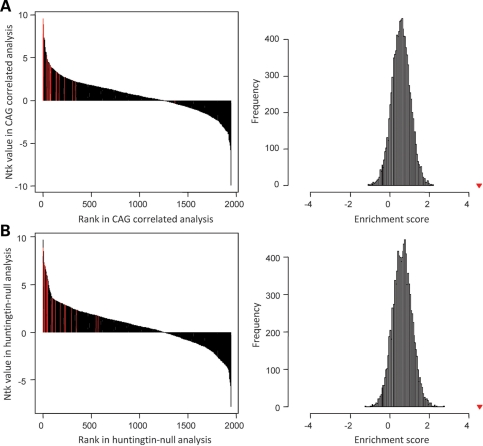
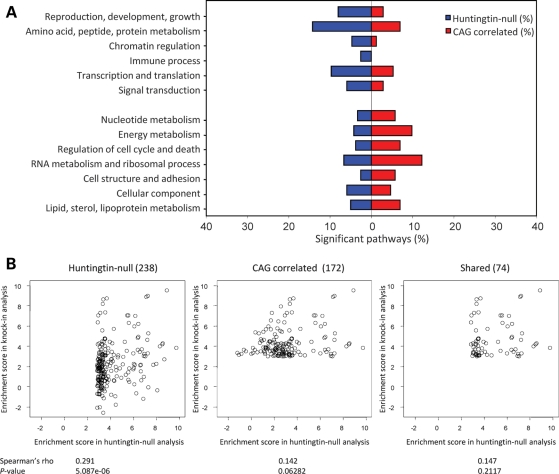
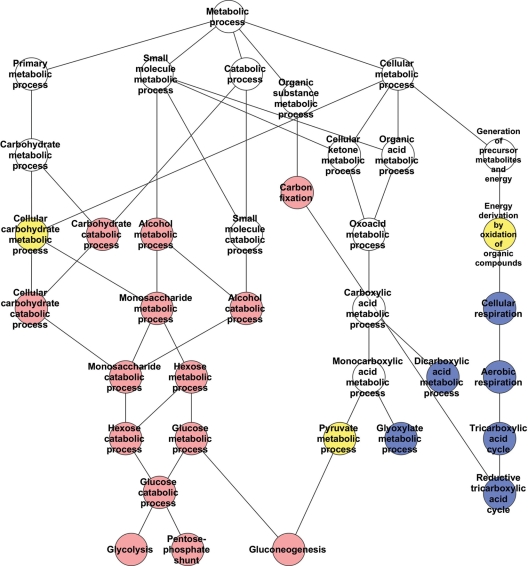
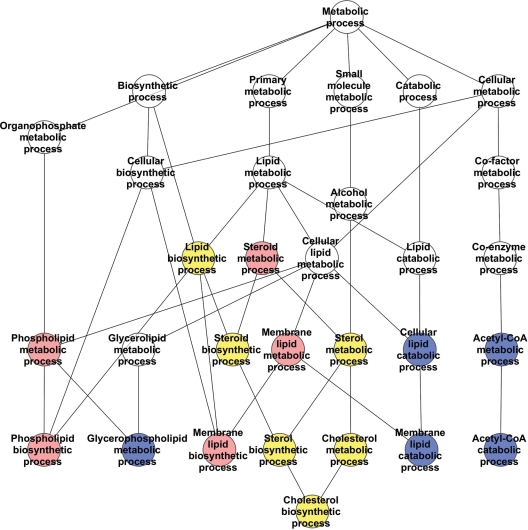
Huntington's disease is initiated by the expression of a CAG repeat-encoded polyglutamine region in full-length huntingtin, with dominant effects that vary continuously with CAG size. The mechanism could involve a simple gain of function or a more complex gain of function coupled to a loss of function (e.g. dominant negative-graded loss of function). To distinguish these alternatives, we compared genome-wide gene expression changes correlated with CAG size across an allelic series of heterozygous CAG knock-in mouse embryonic stem (ES) cell lines (Hdh(Q20/7), Hdh(Q50/7), Hdh(Q91/7), Hdh(Q111/7)), to genes differentially expressed between Hdh(ex4/5/ex4/5) huntingtin null and wild-type (Hdh(Q7/7)) parental ES cells. The set of 73 genes whose expression varied continuously with CAG length had minimal overlap with the 754-member huntingtin-null gene set but the two were not completely unconnected. Rather, the 172 CAG length-correlated pathways and 238 huntingtin-null significant pathways clustered into 13 shared categories at the network level. A closer examination of the energy metabolism and the lipid/sterol/lipoprotein metabolism categories revealed that CAG length-correlated genes and huntingtin-null-altered genes either were different members of the same pathways or were in unique, but interconnected pathways. Thus, varying the polyglutamine size in full-length huntingtin produced gene expression changes that were distinct from, but related to, the effects of lack of huntingtin. These findings support a simple gain-of-function mechanism acting through a property of the full-length huntingtin protein and point to CAG-correlative approaches to discover its effects. Moreover, for therapeutic strategies based on huntingtin suppression, our data highlight processes that may be more sensitive to the disease trigger than to decreased huntingtin levels.


Figures

Figure 1.
Figure 1.
Generation of an allelic panel of heterozygous CAG knock-in ES cell lines. (A) The upper schematic depicts the targeted Hdh CAG knock-in allele in heterozygous Hdhneo20/7, Hdhneo50/7, Hdhneo91/7 and Hdhneo111/7 ES cell lines, with the location of the loxP-flanked PGKneo selection cassette in the promotor region upstream of the chimeric mouse (gray)/human (red) exon 1 with different CAG repeat sizes (CAG 18, CAG 48, CAG 89 and CAG 109), encoding adjacent CAA, CAG codons, the polyglutamine repeat in the full-length endogenous huntingtin. The corresponding PGKneo-out-targeted allele in the cognate Hdh20/7, Hdh50/7, Hdh91/7 and Hdh111/7 ES cell subclones created by Cre-recombinase-mediated excision is depicted below. Arrows denote the locations of primer sets for ‘neo-in’ (2 and 3) and ‘neo-out’ (1 and 3) PCR amplification assays. The schematic is not drawn to scale. The wild-type allele is not shown. (B) Trypan blue staining reveals the growth of G418-resistant (G418R) Hdhneo111/7 (Q111 neo-in) ES cells and the lack of growth of a subclone of G418-sensitive (G418S) Hdh111/7 (Q111 neo-out) ES cells, derived by Cre-recombinase excision of the pGKneo selection cassette. (C) Agarose gel analysis of PCR amplification products generated by specific PGKneo-in (left gel) and PGKneo-out (right gel) assays. The expected bands confirmed the presence of the PGKneo cassette in the parental Hdhneo20/7, Hdhneo50/7, Hdhneo91/7and Hdhneo111/7 ES cell genomic DNAs (lanes left gel) and the proper removal of the PGKneo cassette from the targeted allele in the cognate neo-out Hdh20/7, Hdh50/7, Hdh91/7 and Hdh111/7 ES cell DNAs (lanes on the left gel). The latter assay also amplifies the expected product from the wild-type allele present in all of the ES cell lines, including the Hdhex4/5/ex4/5 ES cell genomic DNA (dKO), which harbor alleles with a targeted inactivating mutation replacing/deleting exons 4 and 5 (data not shown). PCR products were not detected in genomic DNA minus lanes (−ve) for each assay. (D) The immunoblot, detected with mAb2166, confirms proper expression of both full-length wild-type huntingtin (7 glutamines) and, migrating more slowly, huntingtins from the targeted allele with distinct polyglutamine tracts (Q20, Q50, Q91 and Q111) in protein extracts of Hdh20/7, Hdh50/7, Hdh91/7 and Hdh111/7 ES cells, respectively. Wild-type ES cells (Q7/7) express full-length 7-glutamine huntingtin from both alleles and Hdhex4/5/Hdhex4/5-null ES cells (dKO) express no full-length huntingtin. mAb2166 and other anti-huntingtin antibodies differentially detect the huntingtin with the shorter polyglutamine tract, compared with those with the longer tracts, for reasons that are not yet understood. Bands are ∼350 kDa (the position of the 250 kDa marker is not depicted on this immunoblot). An asterisk indicates a cross-reacting band, previously noted (25).
Figure 2.
Figure 2.
ATP/ADP ratio across the members of the ES cell panel. (A) The bar plot summarizes the results of HPLC determination of ATP/ADP ratio for replicates of Hdhex4/5/Hdhex4/5-null ES cells (dKO), expressed as a percentage of the parental wild-type ES cell ATP/ADP ratio, showing a trend (P = 0.057) toward increased ATP/ADP ratio in the absence of full-length huntingtin. All data points are included. (B) The bar plot summarizes the results of HPLC determination of ATP/ADP ratio for two biological replicates performed in duplicate for each member of the Hdh20/7, Hdh50/7, Hdh91/7 and Hdh111/7 knock-in ES series, expressed as a percentage of the Hdh20/7 ATP/ADP ratio, demonstrating a decrease with increasing CAG repeat length (Pearson's correlation coefficient P = 0.018). All data points are included.
Figure 3.
Figure 3.
Comparisons of CAG-correlated and huntingtin-null gene sets. (A) Volcano plot showing −log10(P) (Y-axis) for the 13 probes discovered by the dichotomous analysis of the CAG knock-in ES cell data sets at high statistical stringency (P< 0.001) relative to fold-change (X-axis) (green symbols) and the −log10(P) (Y-axis) for each of these probes in the continuous analysis across the CAG knock-in ES cell data sets relative to Pearson's correlation coefficient (X-axis) (red symbols), demonstrating that none of the significant probes in the dichotomous analysis of the CAG knock-in ES cells was significantly correlated with the CAG repeat size. (B) Volcano plot showing −log10(P) (Y-axis) for the 37 probes discovered by the dichotomous analysis of the CAG knock-in ES cell data sets at more relaxed statistical stringency (P< 0.005) relative to fold-change (X-axis) (green symbols) and the −log10(P) (Y-axis) for each of these probes in the continuous analysis across the CAG knock-in ES cell data sets relative to Pearson's correlation coefficient (X-axis) (red symbols), demonstrating that only one probe from the less-stringent dichotomous analysis of the CAG knock-in ES cells was significantly correlated with the CAG repeat size (filled red circle). (C) Volcano plot showing −log10(P) (Y-axis) for the 754 probes significantly (P< 0.001) different in huntingtin-null ES cell data sets, compared with wild-type parental ES cell data sets (P< 0.001) relative to fold-change (X-axis) (blue symbols) and the −log10(P) (Y-axis) for each of these probes in the continuous analysis across the CAG knock-in ES cell data sets relative to Pearson's correlation coefficient (X-axis) (red symbols), revealing that few of the significant probes in the huntingtin-null ES cells were significantly correlated with the CAG repeat size. Mest, an outlier, was excluded from this analysis. (D) Volcano plot showing −log10(P) (Y-axis) for the 73 probes with expression significantly (P< 0.001) correlated with CAG repeat length across the CAG knock-in ES cell data sets relative to Pearson's correlation coefficient > 0.8 (X-axis) (red symbols) and the −log10(P) (Y-axis) for each of these probes in the huntingtin-null versus wild-type ES cell data set comparison relative to fold-change (X-axis) (blue symbols), demonstrating that most of the CAG-correlated probes were not significantly changed in the absence of huntingtin. The X-axis corresponds to fold-change for the dichotomous analysis and Pearson's correlation coefficient for continuous analysis. Open and filled circles represent non-significant and significant probes, respectively.
Figure 4.
Figure 4.
Tests of gene set enrichment by phenotype permutation analysis. The results of GSEA, using phenotype permutation (1000 iterations), are presented. Top: enrichment score (ES) representing the degree to which the test gene set is overrepresented at the top or bottom of the ranked genes from the other data set; middle: position of the test set probes in the other dataset; bottom: ranked metric (Pearson's correlation coefficient for the CAG-correlated data set or t-statistic for the huntingtin-null data set). The enrichment score (ES) and nominal P-value are shown at the bottom. (A) The probes with significantly increased (left panel) or decreased (right panel) expression in the huntingtin-null ES cell comparison were not significantly enriched in the CAG-correlated knock-in ES cell data set. (B) The probes with expression significantly positively correlated (left) or negatively correlated (right) with the CAG length in the knock-in ES cell data sets were not significantly enriched in the huntingtin-null ES cell data set.
Figure 5.
Figure 5.
Tests of enrichment of significant pathways by permutation analysis. The results of permutation-based enrichment analysis to test whether a sort of the top 20 significant pathways in one paradigm was also significantly enriched in the other paradigm. Left: original sigPathway results (black bars) representing rank (X-axis) and NTk value from gene set permutations (Y-axis), with the rank of test pathways highlighted (red bars). Right: average ranks of test pathways (enrichment score) compared with the distribution obtained from a random sampling of 20 pathways from the compared data set (10 000 permutations). (A) Top 20 huntingtin-null significant pathways in CAG-correlated knock-in ES cell pathways indicated significant enrichment, with an enrichment score of 4.51, compared with a distribution of enrichment scores obtained from a random selection of 20 pathways in knock-in pathway results. (B) Top 20 CAG-correlated pathways in huntingtin-null pathways indicated significant enrichment, with an enrichment score of 4.55, compared with a distribution of enrichment scores obtained from a random selection of 20 pathways in knock-out pathway results. Red triangles in the right panels represent true enrichment scores.
Figure 6.
Figure 6.
CAG-correlated and huntingtin-null pathway categories. A summary of sigPathway analysis results, with significant pathways for each paradigm grouped by category is presented (A), with results of correlation analysis testing the relationship between huntingtin-null significant pathways (KO) and the CAG-correlated pathways (KI) (BD). (A) Bar plot of the proportion (X-axis) of the 238 pathways significantly enriched in the huntingtin-null ES cell comparison (blue) and the 172 significantly CAG-correlated pathways across the knock-in ES cell data sets (red) within 13 shared categories (Y-axis). (B) Left scatter plot displays the relationship of the enrichment scores of 238 huntingtin-null significant pathways (X-axis; NTk values) with the enrichment score for these pathways in the continuous CAG ES cell knock-in pathways analysis (Y-axis; NTk values). The Spearman's rank correlation statistic (rho) and the significant P-value indicate that the huntingtin-null pathways capture to some extent the CAG-correlated pathway set. Middle scatter plot displays the relationship of the enrichment scores of the 172 continuous CAG-correlated pathways (X-axis) with the enrichment score for these pathways from the huntingtin-null analysis (Y-axis). The Spearman's rank correlation statistic (rho) and the non-significant P-value indicate that the pathways significantly altered with the CAG size are not altered by the absence of huntingtin. The right scatter plot shows the relationship between the enrichment scores of 74 pathways significant in both the huntingtin-null ES cell analysis (X-axis) and the CAG continuous ES cell data analysis (Y-axis). The Spearman's rank correlation statistic (rho) and the non-significant P-value indicate that the enrichment score in one analysis does not predict the enrichment score in the other paradigm, indicating that these pathways are not consistently altered in the different paradigms.
Figure 7.
Figure 7.
Energy category pathways network. A schematic demonstrating the hierarchy of relationships between the processes/pathways significantly correlated with the CAG repeat length (red), significantly altered in the absence of huntingtin (blue) or significantly altered in both full-length huntingtin genetic paradigms (yellow). The cellular component ‘Mitochondrial matrix’, significantly altered only in the huntingtin-null ES cell analysis, is not shown. Only directly related pathways are illustrated. The KEGG/GO annotations for the pathways are provided in Supplementary Material, Figure S3.
Figure 8.
Figure 8.
Lipid, sterol and lipoprotein metabolism category pathways network. A schematic demonstrating the hierarchy of relationships between the processes/pathways significantly correlated with the CAG repeat length (red), significantly altered in the absence of huntingtin (blue) or significantly altered in both full-length huntingtin genetic paradigms (yellow). The catalytic activity ‘phospholipase A2’, which is significantly changed only in the absence of huntingtin, is not depicted on the pathway annotation diagram. Only directly related pathways are illustrated. The KEGG/GO annotations for the pathways are provided in Supplementary Material, Figure S4.

References

    1. Vonsattel J.P., DiFiglia M. Huntington disease. J. Neuropathol. Exp. Neurol. 1998;57:369–384. - PubMed
    1. Huntington's Disease Collaborative Research Group. A novel gene containing a trinucleotide repeat that is expanded and unstable on Huntington's disease chromosomes. Cell. 1993;72:971–983. - PubMed
    1. McNeil S.M., Novelletto A., Srinidhi J., Barnes G., Kornbluth I., Altherr M.R., Wasmuth J.J., Gusella J.F., MacDonald M.E., Myers R.H. Reduced penetrance of the Huntington's disease mutation. Hum. Mol. Genet. 1997;6:775–779. - PubMed
    1. Quarrell O.W., Rigby A.S., Barron L., Crow Y., Dalton A., Dennis N., Fryer A.E., Heydon F., Kinning E., Lashwood A., et al. Reduced penetrance alleles for Huntington's disease: a multi-centre direct observational study. J. Med. Genet. 2007;44:e68. - PMC - PubMed
    1. Kenney C., Powell S., Jankovic J. Autopsy-proven Huntington's disease with 29 trinucleotide repeats. Mov. Disord. 2007;22:127–130. - PubMed

Publication types

MeSH terms