. 2011 Jul;31(13):2667-82.
doi: 10.1128/MCB.05266-11. Epub 2011 May 2.

Semiquantitative proteomic analysis of the human spliceosome via a novel two-dimensional gel electrophoresis method

Affiliations

Semiquantitative proteomic analysis of the human spliceosome via a novel two-dimensional gel electrophoresis method

Dmitry E Agafonov et al. Mol Cell Biol. 2011 Jul.

Abstract

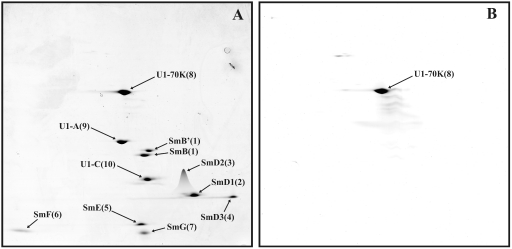
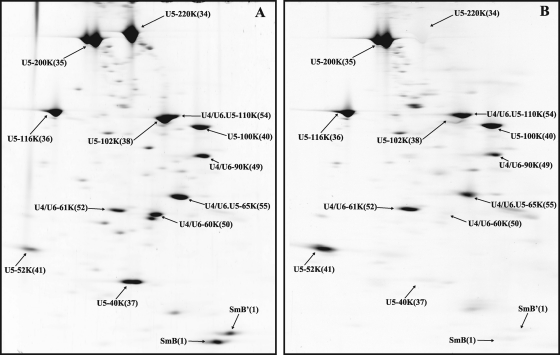
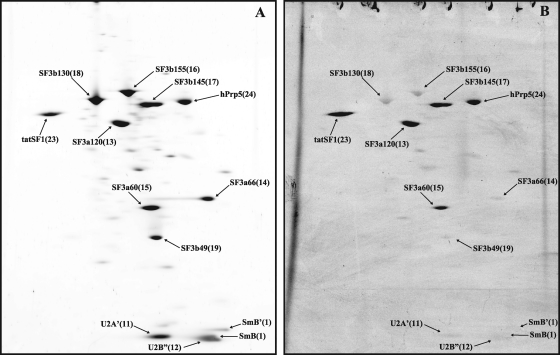
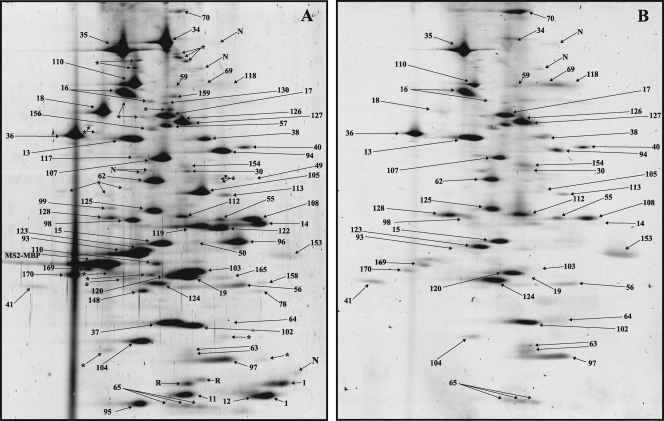
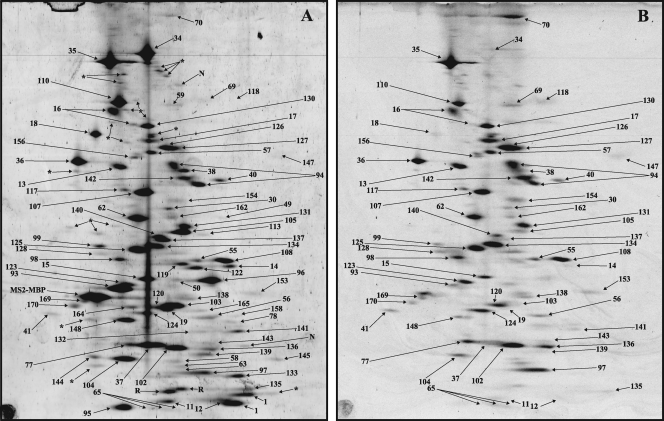
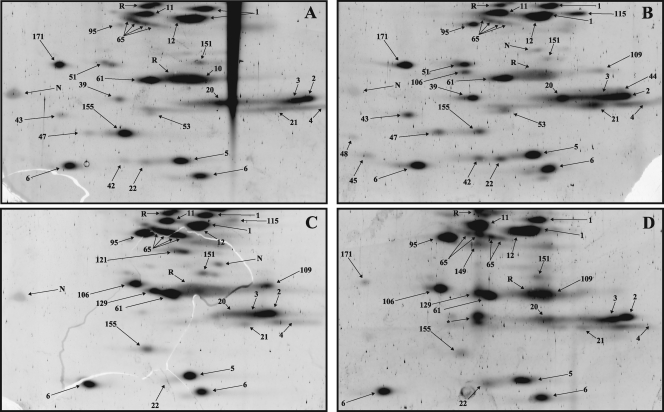
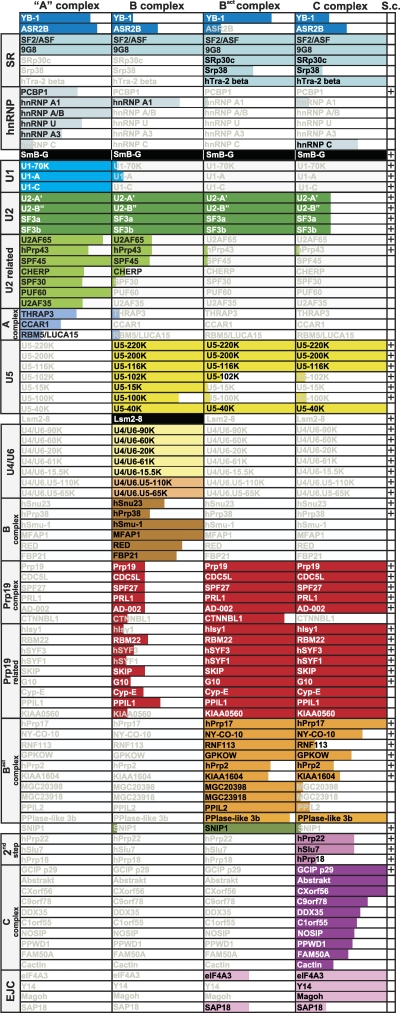
More than 200 proteins associate with human spliceosomes, but little is known about their relative abundances in a given spliceosomal complex. Here we describe a novel two-dimensional (2D) electrophoresis method that allows separation of high-molecular-mass proteins without in-gel precipitation and thus without loss of protein. Using this system coupled with mass spectrometry, we identified 171 proteins altogether on 2D maps of stage-specific spliceosomal complexes. By staining with a fluorescent dye with a wide linear intensity range, we could quantitate and categorize proteins as present in high, moderate, or low abundance. Affinity-purified human B, B(act), and C complexes contained 69, 63, and 72 highly/moderately abundant proteins, respectively. The recruitment and release of spliceosomal proteins were followed based on their abundances in A, B, B(act), and C spliceosomal complexes. Staining with a phospho-specific dye revealed that approximately one-third of the proteins detected in human spliceosomal complexes by 2D gel analyses are phosphorylated. The 2D gel electrophoresis system described here allows for the first time an objective view of the relative abundances of proteins present in a particular spliceosomal complex and also sheds additional light on the spliceosome's compositional dynamics and the phosphorylation status of spliceosomal proteins at specific stages of splicing.


Figures

Fig. 1.
Fig. 1.
2D gel electrophoresis of human U1 snRNP proteins. U1 snRNPs were purified as described in Materials and Methods, and U1-associated proteins were separated by 2D gel electrophoresis using the conditions for the analysis of low-molecular-mass proteins and then stained with Sypro Ruby (A) or with Pro-Q Diamond to detect phosphoproteins (B). Spots were visualized by fluoroimaging. The major spots visible after silver staining were analyzed by mass spectrometry, and the identified proteins are indicated by their common name and a number subsequently used to identify them in Fig. 4 to 8 (see also Table 1).
Fig. 2.
Fig. 2.
2D gel electrophoresis of human U4/U6.U5 tri-snRNP proteins. Tri-snRNPs were purified as described in Materials and Methods, and their associated proteins were separated by 2D gel electrophoresis under conditions used for high-molecular-mass proteins and analyzed as described for Fig. 1. (A) Sypro Ruby staining. (B) Pro-Q Diamond staining. Note that the tri-snRNPs analyzed here are not highly pure, and thus multiple minor spots, which represent contaminants, are also visible.
Fig. 3.
Fig. 3.
2D gel electrophoresis of human 17S U2 snRNP proteins. 17S U2 snRNPs were purified as described in the Materials and Methods and their associated proteins were separated by 2D gel electrophoresis under conditions used for high molecular mass proteins and analyzed as described for Fig. 1. (A) Sypro Ruby staining. (B) Pro-Q Diamond staining.
Fig. 4.
Fig. 4.
2D gel electrophoresis of partially purified human spliceosomal A complexes. Spliceosomal complexes were allowed to form on MINX pre-mRNA and then purified via MS2 affinity selection. Proteins were separated by 2D gel electrophoresis using the conditions for the analysis of high-molecular-mass proteins (see Fig. 8A for analysis of spliceosomal proteins with molecular masses less than 25 kDa) and then stained with Sypro Ruby (A) or with Pro-Q Diamond (B). Spots were visualized by fluoroimaging. All spots visible after silver staining were analyzed by mass spectrometry, and the identified proteins are indicated by a number (see Table 1 for the identities of the numbered spots). MS2-MBP (present in ∼6 copies per complex) is labeled. Spots containing proteolytic fragments are indicated by an asterisk, those not identified are indicated by “N,” and those corresponding to RNases are indicated by “R.”
Fig. 5.
Fig. 5.
2D gel electrophoresis of affinity-purified human spliceosomal B complexes. Spliceosomal complexes were allowed to form on MINX pre-mRNA and then purified and analyzed by 2D gel electrophoresis as described for Fig. 4. (A) Sypro Ruby staining. (B) Pro-Q Diamond staining.
Fig. 6.
Fig. 6.
2D gel electrophoresis of affinity-purified human spliceosomal Bact complexes. Spliceosomal complexes were allowed to form on PM5-20 pre-mRNA and then purified and analyzed by 2D gel electrophoresis as described for Fig. 4. (A) Sypro Ruby staining. (B) Pro-Q Diamond staining.
Fig. 7.
Fig. 7.
2D gel electrophoresis of affinity-purified human spliceosomal C complexes. Spliceosomal complexes were allowed to form on PM5 pre-mRNA and then purified and analyzed by 2D gel electrophoresis as described for Fig. 4. (A) Sypro Ruby staining. (B) Pro-Q Diamond staining.
Fig. 8.
Fig. 8.
2D gel electrophoresis of low-molecular-mass proteins from affinity-purified spliceosomal A (A), B (B), Bact (C), and C (D) complexes. Spliceosomal complexes formed on PM5-based pre-mRNA were analyzed by 2D gel electrophoresis using conditions optimal for the separation of proteins under 25 kDa in mass, and spots were visualized by staining with Sypro Ruby. None of the low-molecular-mass proteins were detected at levels significantly above background upon staining with Pro-Q Diamond (data not shown). Spot no. 171 corresponds to ALG-2/PDCD6 (gi∣121948367) and was abundant only in B complexes formed on the PM5 pre-mRNA.
Fig. 9.
Fig. 9.
Major components of the human A, B, Bact, and C spliceosomal complexes. Only proteins with PAF values above 30 are shown. Note that CBP20/CBP80, as well as individual Sm, LSm, SF3a, and SF3b proteins, are not shown (see also Table 1). The extent of color shading in each column reflects the abundance of each protein, where the entire box is colored for proteins with PAFs above 75. Note that SRSF9, SRSF10, and hTra-2 beta are abundant in A and/or B complexes formed on PM5 but not on MINX pre-mRNA. In the “S.c.” column, a “+” indicates that a homolog is present in the yeast S. cerevisiae.

References

    1. Agafonov D. E., Kolb V. A., Nazimov I. V., Spirin A. S. 1999. A protein residing at the subunit interface of the bacterial ribosome. Proc. Natl. Acad. Sci. U. S. A. 96:12345–12349 - PMC - PubMed
    1. Beausoleil S. A., et al. 2004. Large-scale characterization of HeLa cell nuclear phosphoproteins. Proc. Natl. Acad. Sci. U. S. A. 101:12130–12135 - PMC - PubMed
    1. Behzadnia N., et al. 2007. Composition and three-dimensional EM structure of double affinity-purified, human prespliceosomal A complexes. EMBO J. 26:1737–1748 - PMC - PubMed
    1. Bennett M., Michaud S., Kingston J., Reed R. 1992. Protein components specifically associated with prespliceosome and spliceosome complexes. Genes Dev. 6:1986–2000 - PubMed
    1. Berggren K., et al. 2000. Background-free, high sensitivity staining of proteins in one- and two-dimensional sodium dodecyl sulfate-polyacrylamide gels using a luminescent ruthenium complex. Electrophoresis 21:2509–2521 - PubMed

Publication types

LinkOut - more resources