

Mitochondrial dysfunction in cancer cells due to aberrant mitochondrial replication
- PMID: 21536680
- PMCID: PMC3121380
- DOI: 10.1074/jbc.M111.250092
Mitochondrial dysfunction in cancer cells due to aberrant mitochondrial replication
Abstract
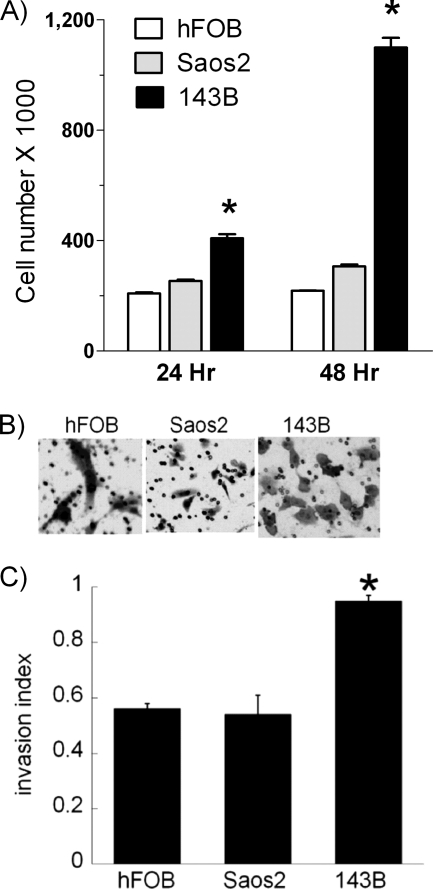
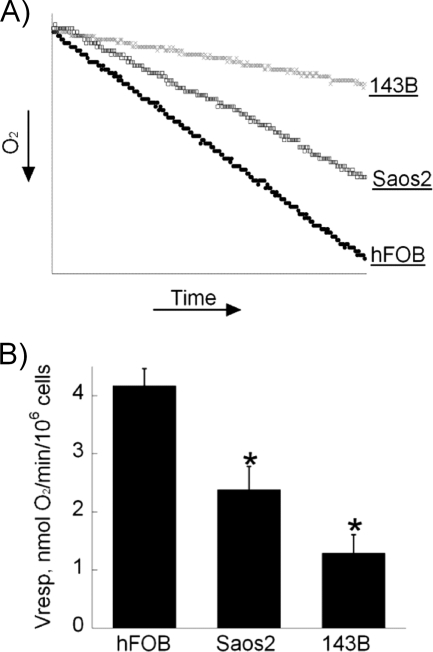
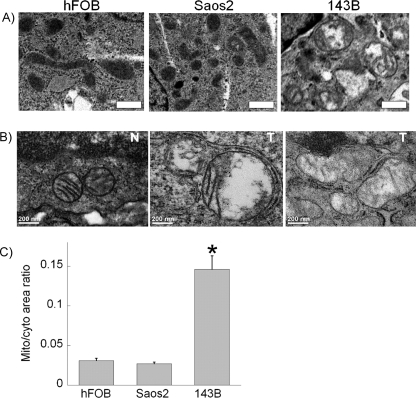
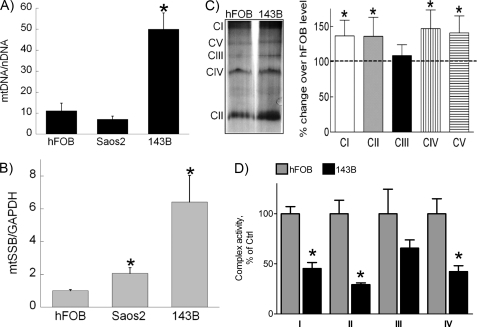
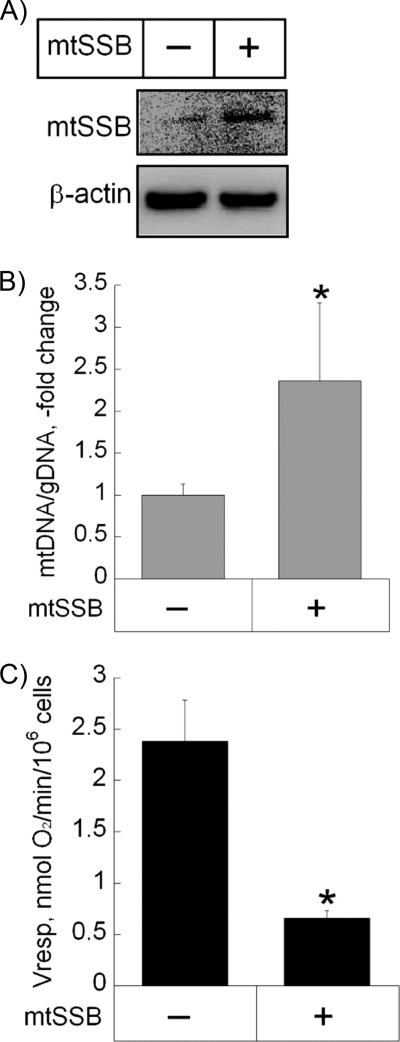
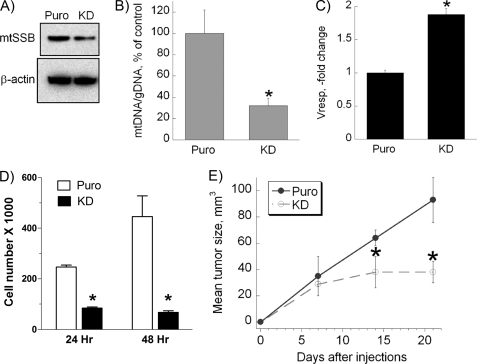
Warburg effect is a hallmark of cancer manifested by continuous prevalence of glycolysis and dysregulation of oxidative metabolism. Glycolysis provides survival advantage to cancer cells. To investigate molecular mechanisms underlying the Warburg effect, we first compared oxygen consumption among hFOB osteoblasts, benign osteosarcoma cells, Saos2, and aggressive osteosarcoma cells, 143B. We demonstrate that, as both proliferation and invasiveness increase in osteosarcoma, cells utilize significantly less oxygen. We proceeded to evaluate mitochondrial morphology and function. Electron microscopy showed that in 143B cells, mitochondria are enlarged and increase in number. Quantitative PCR revealed an increase in mtDNA in 143B cells when compared with hFOB and Saos2 cells. Gene expression studies showed that mitochondrial single-strand DNA-binding protein (mtSSB), a key catalyst of mitochondrial replication, was significantly up-regulated in 143B cells. In addition, increased levels of the mitochondrial respiratory complexes were accompanied by significant reduction of their activities. These changes indicate hyperactive mitochondrial replication in 143B cells. Forced overexpression of mtSSB in Saos2 cells caused an increase in mtDNA and a decrease in oxygen consumption. In contrast, knockdown of mtSSB in 143B cells was accompanied by a decrease in mtDNA, increase in oxygen consumption, and retardation of cell growth in vitro and in vivo. In summary, we have found that mitochondrial dysfunction in cancer cells correlates with abnormally increased mitochondrial replication, which according to our gain- and loss-of-function experiments, may be due to overexpression of mtSSB. Our study provides insight into mechanisms of mitochondrial dysfunction in cancer and may offer potential therapeutic targets.
Figures
Similar articles
-
Mitochondrial dysfunction and permeability transition in osteosarcoma cells showing the Warburg effect.J Biol Chem. 2013 Nov 15;288(46):33303-11. doi: 10.1074/jbc.M113.507129. Epub 2013 Oct 7. J Biol Chem. 2013. PMID: 24100035 Free PMC article.
-
Reduced stimulation of recombinant DNA polymerase γ and mitochondrial DNA (mtDNA) helicase by variants of mitochondrial single-stranded DNA-binding protein (mtSSB) correlates with defects in mtDNA replication in animal cells.J Biol Chem. 2011 Nov 25;286(47):40649-58. doi: 10.1074/jbc.M111.289983. Epub 2011 Sep 26. J Biol Chem. 2011. PMID: 21953457 Free PMC article.
-
Upregulation of mtSSB by interleukin-6 promotes cell growth through mitochondrial biogenesis-mediated telomerase activation in colorectal cancer.Int J Cancer. 2019 May 15;144(10):2516-2528. doi: 10.1002/ijc.31978. Epub 2018 Dec 6. Int J Cancer. 2019. PMID: 30415472
-
Phenethyl isothiocyanate induces oxidative cell death in osteosarcoma cells with regulation on mitochondrial network, function and metabolism.Biochim Biophys Acta Mol Basis Dis. 2023 Aug;1869(6):166740. doi: 10.1016/j.bbadis.2023.166740. Epub 2023 May 2. Biochim Biophys Acta Mol Basis Dis. 2023. PMID: 37142133
-
2-Methoxyestradiol Reverses the Pro-Carcinogenic Effect of L-Lactate in Osteosarcoma 143B Cells.Cancer Genomics Proteomics. 2017 Nov-Dec;14(6):483-493. doi: 10.21873/cgp.20058. Cancer Genomics Proteomics. 2017. PMID: 29109098 Free PMC article. Review.
Cited by
-
Energy Metabolism in Mesenchymal Stem Cells During Osteogenic Differentiation.Stem Cells Dev. 2016 Jan 15;25(2):114-22. doi: 10.1089/scd.2015.0193. Epub 2015 Dec 10. Stem Cells Dev. 2016. PMID: 26487485 Free PMC article.
-
Vnn1 pantetheinase limits the Warburg effect and sarcoma growth by rescuing mitochondrial activity.Life Sci Alliance. 2018 Jul 23;1(4):e201800073. doi: 10.26508/lsa.201800073. eCollection 2018 Aug. Life Sci Alliance. 2018. PMID: 30456364 Free PMC article.
-
Mitochondrial dysfunction and permeability transition in osteosarcoma cells showing the Warburg effect.J Biol Chem. 2013 Nov 15;288(46):33303-11. doi: 10.1074/jbc.M113.507129. Epub 2013 Oct 7. J Biol Chem. 2013. PMID: 24100035 Free PMC article.
-
miR‑4262 inhibits colon cancer cell proliferation via targeting of GALNT4.Mol Med Rep. 2017 Oct;16(4):3731-3736. doi: 10.3892/mmr.2017.7057. Epub 2017 Jul 21. Mol Med Rep. 2017. PMID: 28731150 Free PMC article.
-
Polyphenols and Exercise in Mitochondrial Biogenesis: Focus on Age-Related CNS Disorders.Mol Neurobiol. 2025 Jun 13. doi: 10.1007/s12035-025-05121-y. Online ahead of print. Mol Neurobiol. 2025. PMID: 40512338 Review.
References
-
- Warburg O. (1930) The Metabolism of Tumours, Constable Press, London
-
- Warburg O. (1956) Science 123, 309–314 - PubMed
-
- Gatenby R. A., Gillies R. J. (2007) Int. J. Biochem. Cell Biol. 39, 1358–1366 - PubMed
-
- Gatenby R. A., Gillies R. J. (2004) Nat. Rev. Cancer 4, 891–899 - PubMed
-
- Eliseev R. A., Zuscik M. J., Schwarz E. M., O'Keefe R. J., Drissi H., Rosier R. N. (2005) J. Cell. Biochem. 96, 1262–1273 - PubMed
Publication types
MeSH terms
Substances
Grants and funding
LinkOut - more resources
Full Text Sources
Other Literature Sources
