. 2011 Jun;17(6):991-1011.
doi: 10.1261/rna.2619511. Epub 2011 May 2.

Identification of potential conserved RNA secondary structure throughout influenza A coding regions

Affiliations

Identification of potential conserved RNA secondary structure throughout influenza A coding regions

Walter N Moss et al. RNA. 2011 Jun.

Abstract

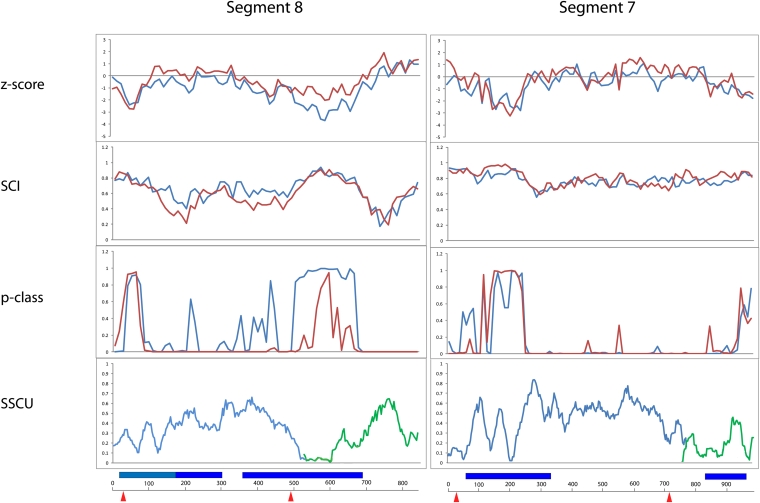
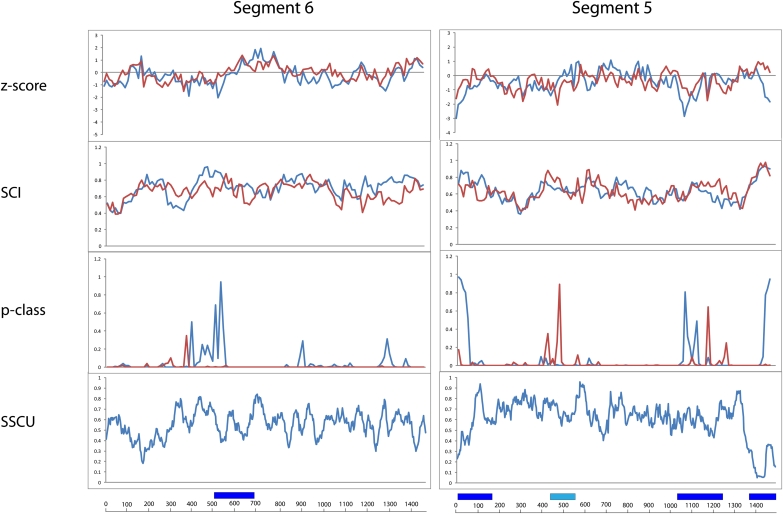
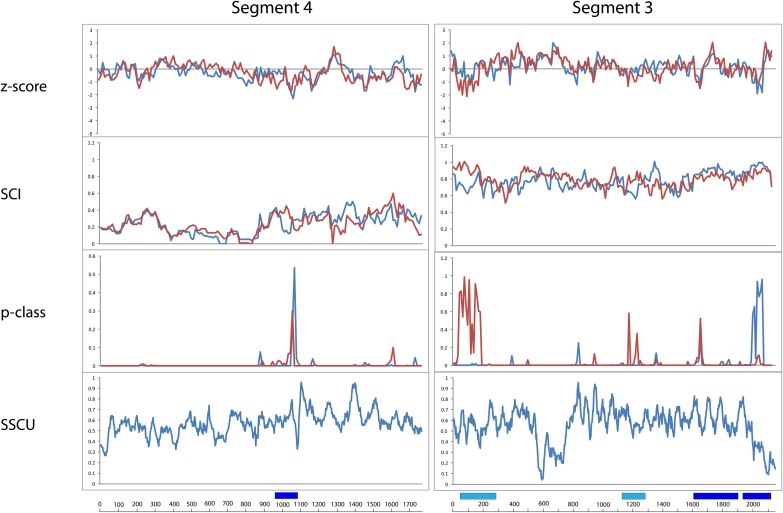
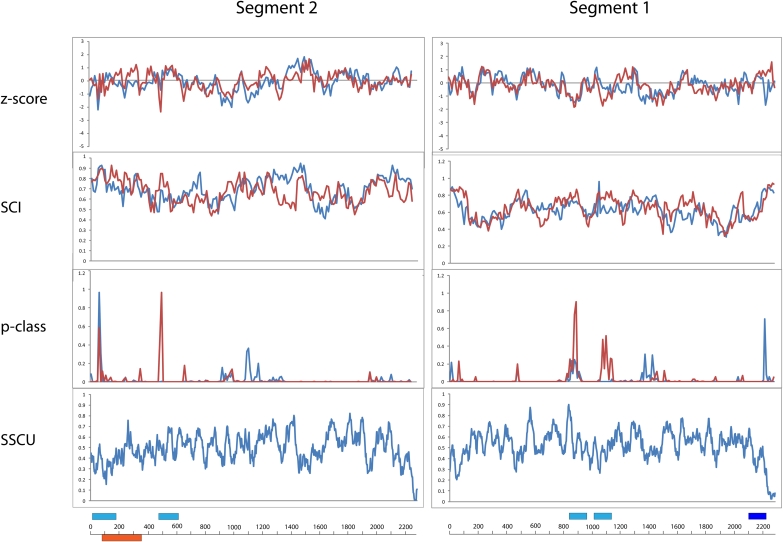
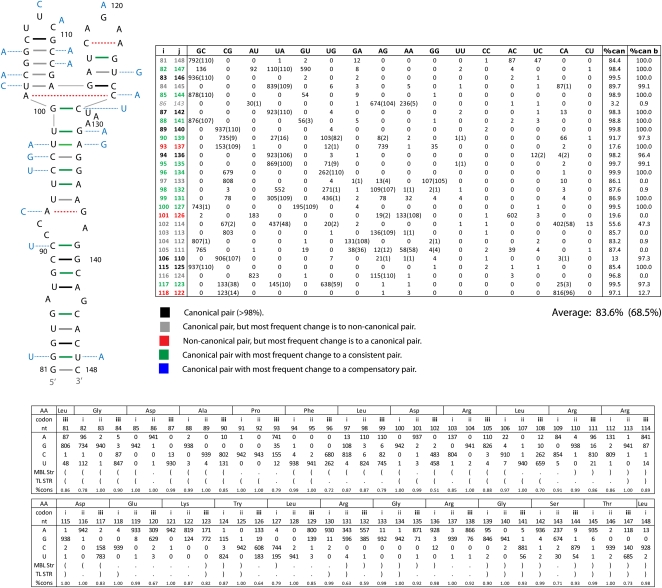
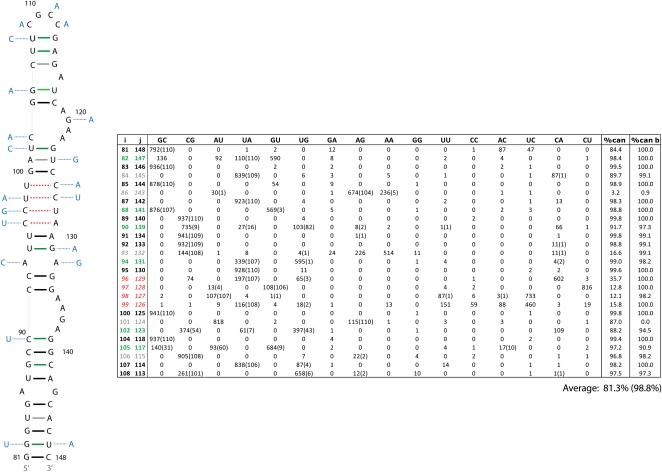
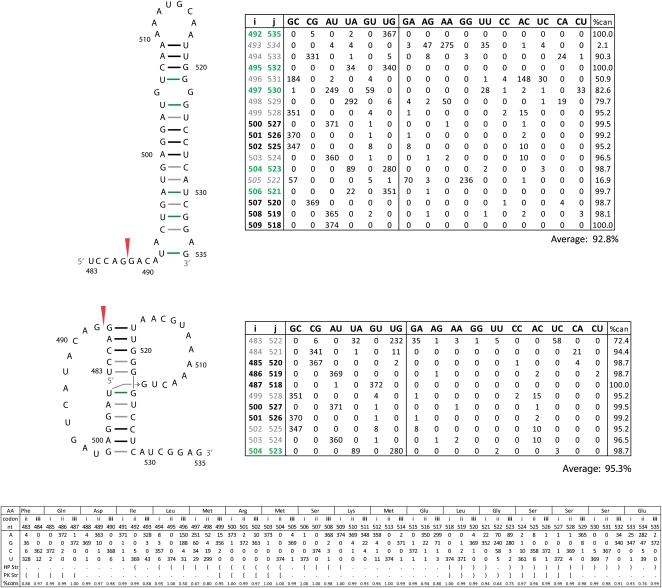
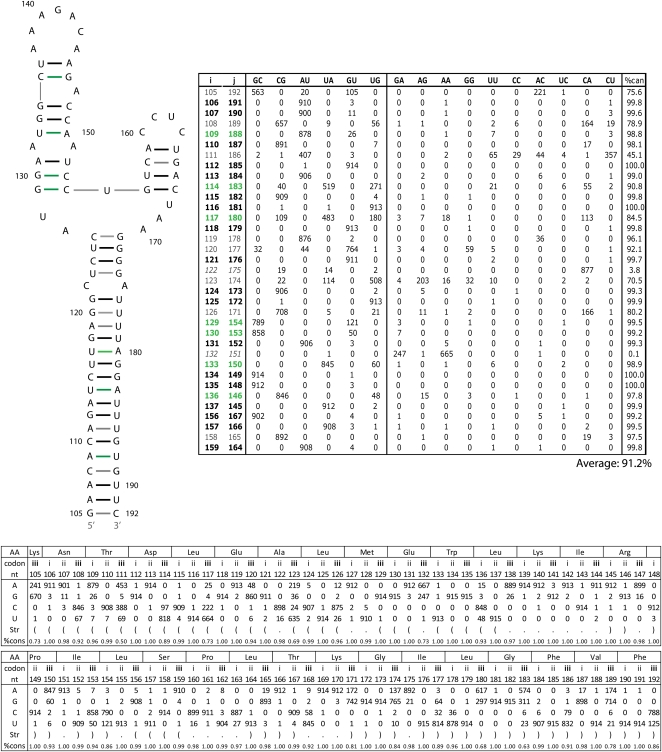
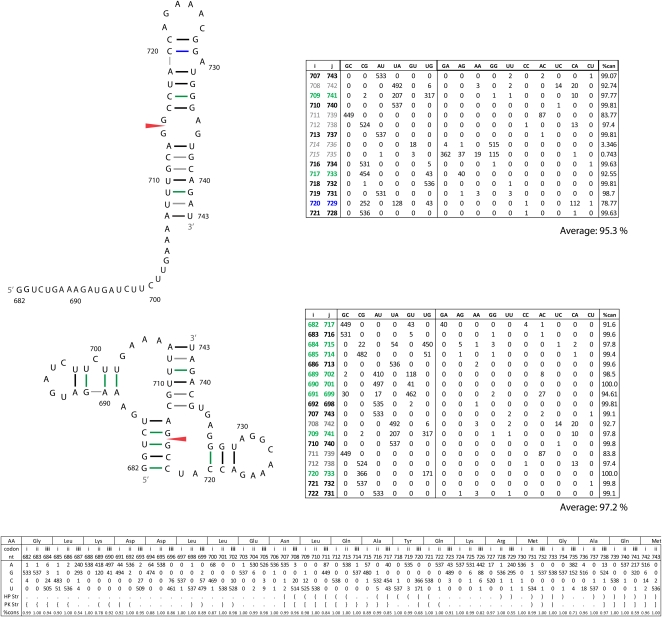
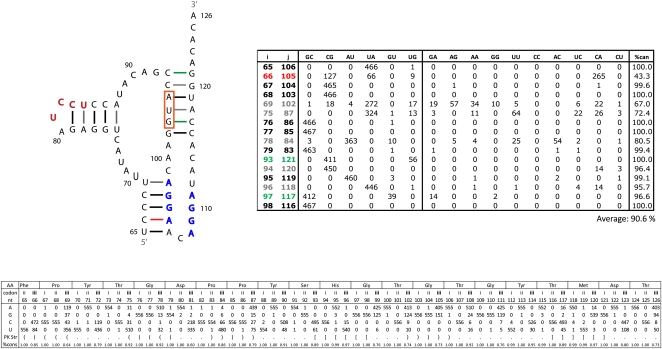
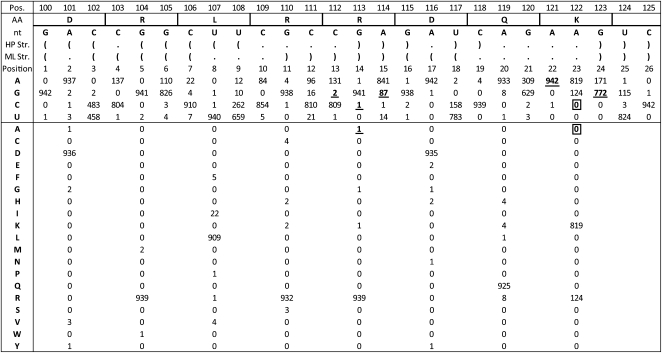
Influenza A is a negative sense RNA virus of significant public health concern. While much is understood about the life cycle of the virus, knowledge of RNA secondary structure in influenza A virus is sparse. Predictions of RNA secondary structure can focus experimental efforts. The present study analyzes coding regions of the eight viral genome segments in both the (+) and (-) sense RNA for conserved secondary structure. The predictions are based on identifying regions of unusual thermodynamic stabilities and are correlated with studies of suppression of synonymous codon usage (SSCU). The results indicate that secondary structure is favored in the (+) sense influenza RNA. Twenty regions with putative conserved RNA structure have been identified, including two previously described structured regions. Of these predictions, eight have high thermodynamic stability and SSCU, with five of these corresponding to current annotations (e.g., splice sites), while the remaining 12 are predicted by the thermodynamics alone. Secondary structures with high conservation of base-pairing are proposed within the five regions having known function. A combination of thermodynamics, amino acid and nucleotide sequence comparisons along with SSCU was essential for revealing potential secondary structures.


Figures

FIGURE 1.
FIGURE 1.
Results of RNAz calculations and suppression of synonymous codon usage (SSCU) studies for coding regions of segments 8 and 7. (Red lines) (−)RNA; (blue lines) (+)RNA. The first plot gives the calculated Z-score, which is a measure of the “excess” free energy of folding a native RNA sequence vs. random sequence. The second plot gives the structure conservation index (SCI), which indicates how well represented the consensus structure is in predictions of individual sequence secondary structures (y-axis indicates the fraction of conservation). The third plot shows the RNAz probability (p-class) of the presence of conserved structural RNA. The bottom panel shows the results for the SSCU calculations, which measure the variation at the third codon position (y-axis gives the distance at the third codon position). Here, low distance/variation indicates strong SSCU. Results for the larger ORF (blue) and the smaller (green). (Below the bottom panel) The common x-axis indicates the input alignment position in nucleotides. (Dark blue bars) Overlapping RNAz predictions clearly in the (+) sense; (light blue bars) RNAz predictions with ambiguous strand bias; (red arrows) the splice sites.
FIGURE 2.
FIGURE 2.
Results of RNAz calculations and suppression of synonymous codon usage (SSCU) studies for segments 6 and 5. Figure annotations are as in Figure 1.
FIGURE 3.
FIGURE 3.
Results of RNAz calculations and suppression of synonymous codon usage (SSCU) studies for segments 4 and 3. Figure annotations are as in Figure 1.
FIGURE 4.
FIGURE 4.
Results of RNAz calculations and suppression of synonymous codon usage (SSCU) studies for segments 2 and 1. Figure annotations are as in Figure 1; (orange bar) the internal ORF for the PB1-F2 product.
FIGURE 5.
FIGURE 5.
RNAalifold predicted secondary structure from the RNAz alignment for fragment of 5′ predicted secondary structure region from segment 8 (+)RNA. This structure was also predicted by Ilyinskii et al. (2009). Base pairs are color annotated with information from base pair counts (tabulated to the right of the structure) from an alignment of all available unique sequences. The color annotation key is given below the table. Pairing type is given at the top of the table; canonical pairs to the left, and noncanonical to the right. The “%can” column gives the percentage of canonical pairs found in those aligned positions. Italicized alignment positions (i–j) are for symmetric internal loop bases. The average percent conservation of the whole structure is given below the table. Base pair counts for all unique sequences and cluster b sequences are given without and with parenthesis, respectively. Cluster b consensus sequence is indicated by light blue nucleotides. The predicted free energies of folding, ΔG37° (Mathews et al. 2004), for the consensus sequence of all unique sequences is −19.7 kcal/mol and for cluster b sequences is −8.6 kcal/mol. Nucleotide composition by alignment position is summarized at the bottom of the figure. The structure is notated in bracket notion, codon position is indicated by roman numerals, and consensus amino acid sequence is notated at the top of the table. The percent conservation for each position is also given.
FIGURE 6.
FIGURE 6.
Alternative secondary structure for the region shown in Figure 5. This was predicted by RNAalifold using the SSCU alignment of segment 8 sequences. Figure annotations and base pair counts are as described in Figure 5. Base pair counts for all unique sequences and cluster b sequences are given without and with parentheses, respectively. Cluster b consensus sequence is indicated by light blue nucleotides. The predicted free energies of folding, ΔG37° (Mathews et al. 2004) for the consensus sequence of all unique sequences is −9.6 kcal/mol and for cluster b sequences is −23.8 kcal/mol.
FIGURE 7.
FIGURE 7.
Nondenaturing 8% polyacrylamide gel of in vitro folded cluster a and cluster b sequences from Figures 5 and 6 (see Materials and Methods). Final Mg++ concentrations are 0, 5, 10, and 15 mM. Two bands are apparent in the clade b samples: slower and faster migrating products that account for 57% and 43% of the integrated band intensity, respectively.
FIGURE 8.
FIGURE 8.
Secondary structure models for fragment of 3′ predicted secondary structure region from segment 8 (+)RNA. The top structure is for the hairpin predicted by RNAalifold on the SSCU alignment, while the alternative pseudoknot conformation is shown below. These structures were also predicted by Gultyaev et al. (2007). Figure annotations and base pair counts are as described in Figure 5. The predicted free energy of folding, ΔG37° (Mathews et al. 2004), for the consensus hairpin is −18.9 kcal/mol. Predicted free energies for the pseudoknot were calculated as −9 kcal/mol (Dirks and Pierce 2003; Cao and Chen 2009).
FIGURE 9.
FIGURE 9.
RNAalifold predicted secondary structure for fragment of 5′ predicted secondary structure region from the RNAz and the SSCU alignments of segment 7 (+)RNA. Figure annotations and base pair counts are as described in Figure 5. The predicted free energy of folding, ΔG37° (Mathews et al. 2004), for the consensus sequence is −30.0 kcal/mol.
FIGURE 10.
FIGURE 10.
Secondary structures predicted for a fragment of the 3′ region of segment 7 (+)RNA. The top structure is for the hairpin predicted by RNAalifold on the SSCU alignment, while the alternative pseudoknot conformation is shown below. Figure annotations and base pair counts are as described in Figure 5. The predicted free energy of folding, ΔG37° (Mathews et al. 2004), for the consensus hairpin is −14.3 kcal/mol. Predicted free energies for the pseudoknot were calculated as −7 (DP) or −4 (CC) kcal/mol, depending on the parameters used (Dirks and Pierce 2003; Cao and Chen 2006). A slipped helix with G691–C700 and A692–U699 pairs results in a more favorable predicted free energy range of −12 (DP) to −9 (CC), but less favorable percentage of canonical pairing of 79.4% and 89.2%, respectively, for these base pairs.
FIGURE 11.
FIGURE 11.
DotKnot (Sperschneider and Datta 2010) secondary structure model for 5′ region 65–126 from segment 2 of genome set 755298. Other predictions by DotKnot for this region are represented by blue shaded nucleotides, which can base-pair with the red shaded nucleotides to form two alternate 5′ helices leaving nucleotides 65–80 unpaired. Base pair counts from an alignment of all unique segment 2 sequences are shown to the right. The nucleotides boxed in orange in the 3′ pseudoknot helix are the start codon for the internal ORF for the PB1-F2 product. This ORF is shifted +1 compared to the PB1 coding region. Figure annotations and base pair counts are as described in Figure 5. Predicted free energies for the pseudoknot were calculated as −14 (DP) or −8 (CC) kcal/mol, depending on the parameters used (Dirks and Pierce 2003; Cao and Chen 2009).
FIGURE 12.
FIGURE 12.
Segment 8 sequence from nucleotides 100–125 compared to amino acid coding for region with mutations reported by Ilyinskii et al. (2009). The top row has the alignment positions. Below are given the consensus amino acid sequence and primary nucleotide sequence. Position 102 is a C to represent the consensus sequence for this region, but a U is used at this position in Figure 5 to more accurately represent the canonical pairing in the structural model. Natural occurrences of the NS1mut3841 mutations made by Ilyinskii et al. (2009) are underlined, while the mutations never observed naturally are boxed.

Similar articles

Cited by

References

    1. Ataide SF, Schmitz N, Shen K, Ke A, Shan SO, Doudna JA, Ban N 2011. The crystal structure of the signal recognition particle in complex with its receptor. Science 331: 881–886 - PMC - PubMed
    1. Bao Y, Bolotov P, Dernovoy D, Kiryutin B, Zaslavsky L, Tatusova T, Ostell J, Lipman D 2008. The influenza virus resource at the National Center for Biotechnology Information. J Virol 82: 596–601 - PMC - PubMed
    1. Basler CF, Reid AH, Dybing JK, Janczewski TA, Fanning TG, Zheng H, Salvatore M, Perdue ML, Swayne DE, García-Sastre A 2001. Sequence of the 1918 pandemic influenza virus nonstructural gene (NS) segment and characterization of recombinant viruses bearing the 1918 NS genes. Proc Natl Acad Sci 98: 2746–2751 - PMC - PubMed
    1. Baudin F, Bach C, Cusack S, Ruigrok RW 1994. Structure of influenza virus RNP. I. Influenza virus nucleoprotein melts secondary structure in panhandle RNA and exposes the bases to the solvent. EMBO J 13: 3158–3165 - PMC - PubMed
    1. Bernhart SH, Hofacker IL, Will S, Gruber AR, Stadler PF 2008. RNAalifold: Improved consensus structure prediction for RNA alignments. BMC Bioinformatics 9: 474–486 - PMC - PubMed

Publication types

LinkOut - more resources