. 2011 Jun;21(6):991-8.
doi: 10.1101/gr.116335.110. Epub 2011 May 2.

RNA-sequence analysis of human B-cells

Affiliations

RNA-sequence analysis of human B-cells

Jonathan M Toung et al. Genome Res. 2011 Jun.

Abstract

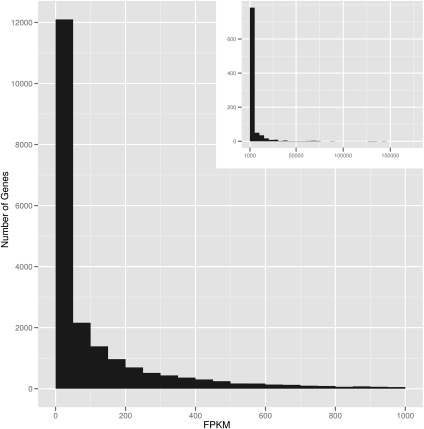
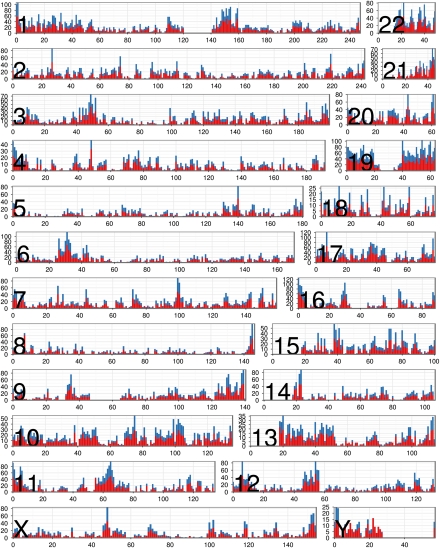
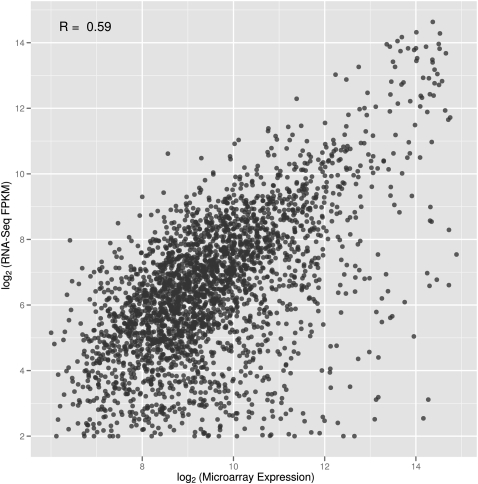
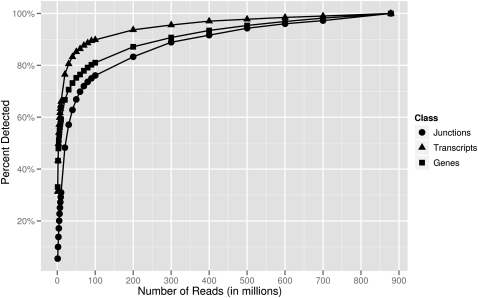
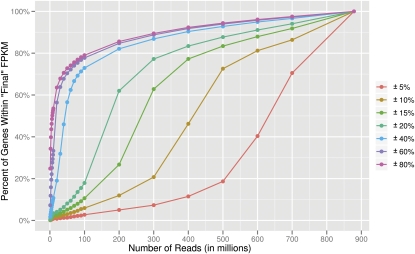
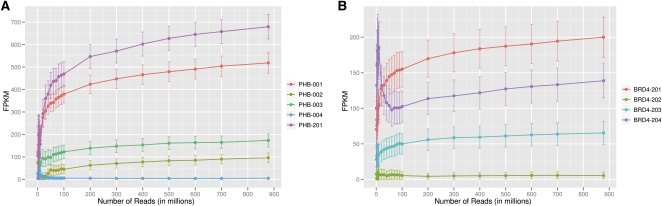
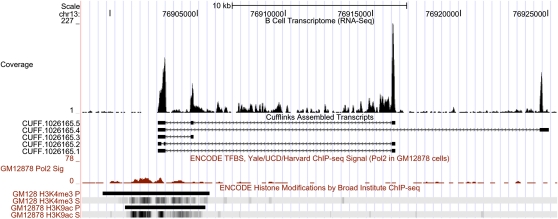
RNA-sequencing (RNA-seq) allows quantitative measurement of expression levels of genes and their transcripts. In this study, we sequenced complementary DNA fragments of cultured human B-cells and obtained 879 million 50-bp reads comprising 44 Gb of sequence. The results allowed us to study the gene expression profile of B-cells and to determine experimental parameters for sequencing-based expression studies. We identified 20,766 genes and 67,453 of their alternatively spliced transcripts. More than 90% of the genes with multiple exons are alternatively spliced; for most genes, one isoform is predominantly expressed. We found that while chromosomes differ in gene density, the percentage of transcribed genes in each chromosome is less variable. In addition, genes involved in related biological processes are expressed at more similar levels than genes with different functions. Besides characterizing gene expression, we also used the data to investigate the effect of sequencing depth on gene expression measurements. While 100 million reads are sufficient to detect most expressed genes and transcripts, about 500 million reads are needed to measure accurately their expression levels. We provide examples in which deep sequencing is needed to determine the relative abundance of genes and their isoforms. With data from 20 individuals and about 40 million sequence reads per sample, we uncovered only 21 alternatively spliced, multi-exon genes that are not in databases; this result suggests that at this sequence coverage, we can detect most of the known genes. Results from this project are available on the UCSC Genome Browser to allow readers to study the expression and structure of genes in human B-cells.


Figures

Figure 1.
Figure 1.
Distribution of FPKM values for Gencode genes. The distribution of gene expression values is skewed right; the median and mean FPKM values are 26 and 338, respectively. The main figure shows genes with FPKM values less than 1000. (Inset) Genes with FPKM values greater than 1000. For percentiles of FPKM values for genes and transcripts, see Supplemental Tables 2 and 3.
Figure 2.
Figure 2.
Distribution of expressed genes by chromosome. For each chromosome, we plotted the number (y-axis) of Gencode genes residing in 1-Mb intervals along the chromosome (x-axis depicts physical distance in megabases). (Red) The number of genes that are expressed (FPKM ≥0.05); (blue) the number that are not expressed.
Figure 3.
Figure 3.
Expression values from RNA-seq and microarray. Comparison of FPKM values (log2-transformed) and microarray signals for the 2597 genes detected by both platforms in 20 unrelated individuals. For each gene, we plotted the average expression values across the 20 individuals.
Figure 4.
Figure 4.
Number of junctions, transcripts, and genes detected at different sequencing depths. The numbers of genes, transcripts, and junctions detected in our 879-million-read data set were assumed to be the “final” values. Then, the percentages of these “final” values detected at various sequencing depths were determined. For example, with 100 million reads, 76% of the junctions, 90% of transcripts, and 81% of genes were detected.
Figure 5.
Figure 5.
Gene expression levels at different sequencing depths. The percentages of genes that reach values within different percentages of the “final” level obtained at a depth of 879 million reads were determined. With 100 million reads, only 6% of genes have FPKM measurements that are within 10% (gold line) of their “final” value compared to 72% at a depth of 500 million reads.
Figure 6.
Figure 6.
Expression levels versus sequencing depth. We plotted FPKM values for genes and their transcripts at various sequencing depths. (A) FPKM values of five spliced forms of PHB are shown; the least abundant isoform (blue line) of PHB reaches within 20% of its “final” FPKM value with only 60 million reads; however, the expression values of the other four isoforms continued to increase with more reads. (B) FPKM values of BRD4 are shown. With less than 100 million reads, the expression level of BRD4-201 (orange line) is overestimated, while that of BRD4-204 (purple line) is underestimated. (Error bars represent 95% confidence intervals.)
Figure 7.
Figure 7.
Newly identified gene on chromosome 13. This gene has five alternatively spliced transcripts. The RNA polymerase II peak and H3K4Me3 and H3K9Ac marks are located at the 5′ ends of the gene.

References

    1. Ashburner M, Ball CA, Blake JA, Botstein D, Butler H, Cherry JM, Davis AP, Dolinski K, Dwight SS, Eppig JT, et al. 2000. Gene Ontology: tool for the unification of biology. The Gene Ontology Consortium. Nat Genet 25: 25–29 - PMC - PubMed
    1. Bentley DR, Balasubramanian S, Swerdlow HP, Smith GP, Milton J, Brown CG, Hall KP, Evers DJ, Barnes CL, Bignell HR, et al. 2008. Accurate whole human genome sequencing using reversible terminator chemistry. Nature 456: 53–59 - PMC - PubMed
    1. Brenner S, Johnson M, Bridgham J, Golda G, Lloyd DH, Johnson D, Luo S, McCurdy S, Foy M, Ewan M, et al. 2000. Gene expression analysis by massively parallel signature sequencing (MPSS) on microbead arrays. Nat Biotechnol 18: 630–634 - PubMed
    1. Cloonan N, Forrest AR, Kolle G, Gardiner BB, Faulkner GJ, Brown MK, Taylor DF, Steptoe AL, Wani S, Bethel G, et al. 2008. Stem cell transcriptome profiling via massive-scale mRNA sequencing. Nat Methods 5: 613–619 - PubMed
    1. Dausset J, Cann H, Cohen D, Lathrop M, Lalouel JM, White R 1990. Centre d'etude du polymorphisme humain (CEPH): Collaborative genetic mapping of the human genome. Genomics 6: 575–577 - PubMed

Publication types

MeSH terms

Associated data