. 2011 Jun;21(6):925-35.
doi: 10.1101/gr.116103.110. Epub 2011 May 2.

Transcript amplification from single bacterium for transcriptome analysis

Affiliations

Transcript amplification from single bacterium for transcriptome analysis

Yun Kang et al. Genome Res. 2011 Jun.

Abstract

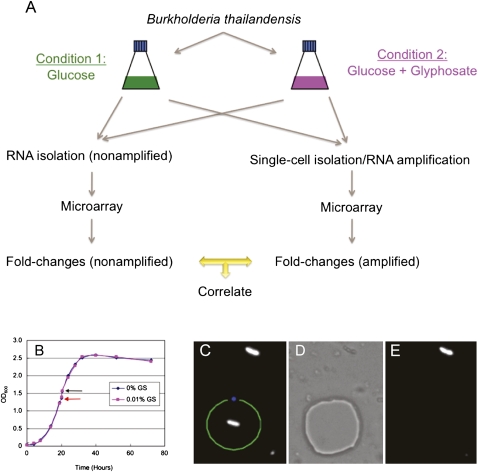
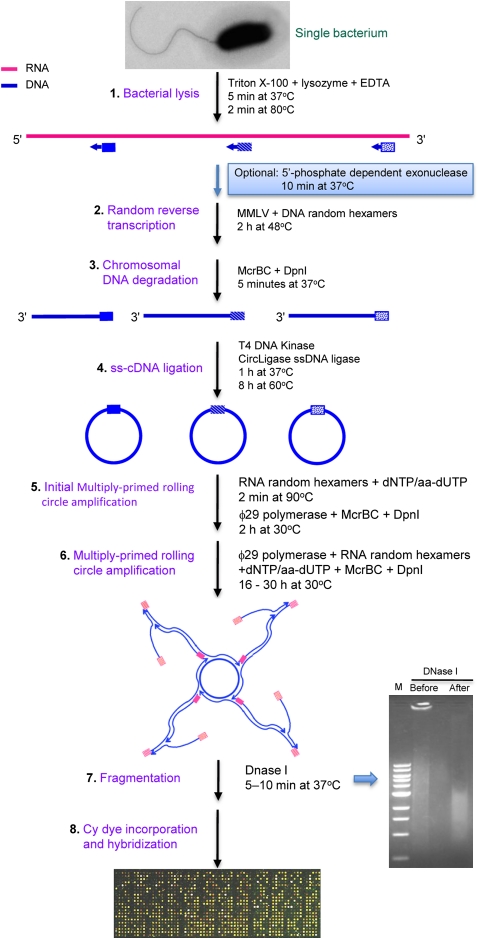
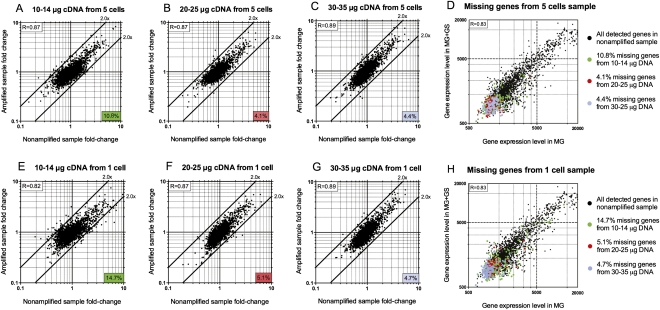
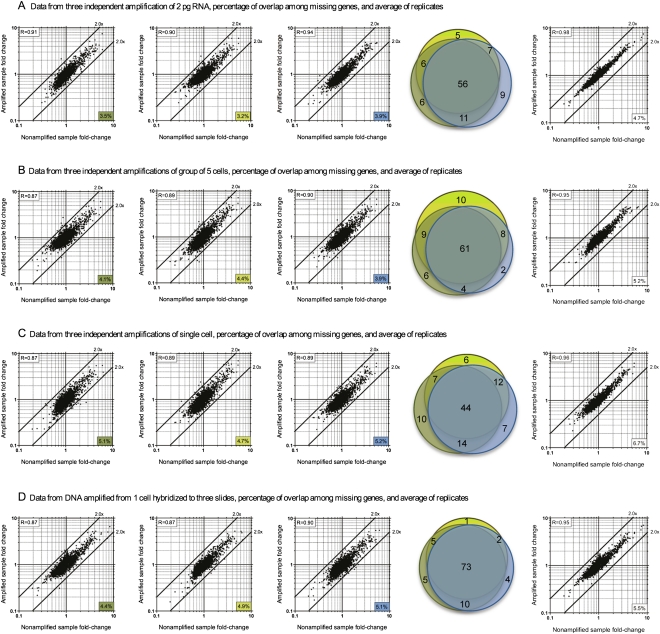
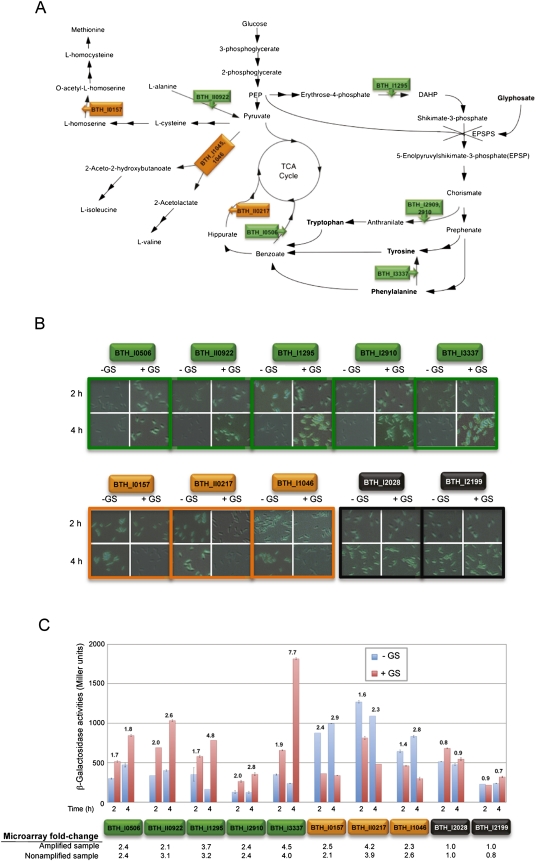
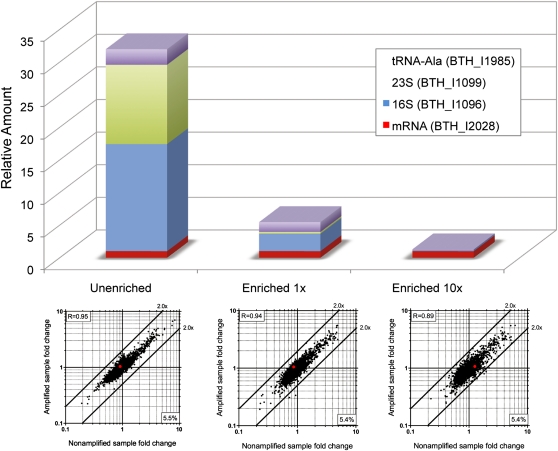
Total transcript amplification (TTA) from single eukaryotic cells for transcriptome analysis is established, but TTA from a single prokaryotic cell presents additional challenges with much less starting material, the lack of poly(A)-tails, and the fact that the messages can be polycistronic. Here, we describe a novel method for single-bacterium TTA using a model organism, Burkholderia thailandensis, exposed to a subinhibitory concentration of the antibacterial agent, glyphosate. Utilizing a B. thailandensis microarray to assess the TTA method showed low fold-change bias (less than twofold difference and Pearson correlation coefficient R ≈ 0.87-0.89) and drop-outs (4%-6% of 2842 detectable genes), compared with data obtained from the larger-scale nonamplified RNA samples. Further analysis of the microarray data suggests that B. thailandensis, when exposed to the aromatic amino acid biosynthesis inhibitor glyphosate, induces (or represses) genes to possibly recuperate and balance the intracellular amino acid pool. We validated our single-cell microarray data at the multi-cell and single-cell levels with lacZ and gfp reporter-gene fusions, respectively. Sanger sequencing of 192 clones generated from the TTA product of a single cell, with and without enrichment by elimination of rRNA and tRNA, detected only B. thailandensis sequences with no contamination. These data indicate that RNA-seq of TTA from a single cell is possible using this novel method.


Figures

Figure 1.
Figure 1.
Single B. thailandensis cell isolation. (A) Experimental design for evaluating the single-cell transcript amplification method. B. thailandensis grown in two different conditions were used in large-scale (nonamplified) and single-cell level (amplified) microarray analysis. Fold-changes (between condition 1 and 2) of all genes detected from the nonamplified and amplified samples were then compared by correlation analysis. (B) Comparable growth curves of B. thailandensis in MG medium ± 0.01% GS (w/v) added at mid-log phase (red arrow) and harvested 30 min post-exposure (black arrow). (C) Fluorescent B. thailandensis cells were observed under 1000× magnification. The section of the membrane containing a single bacterium was drawn and cut by the focused laser (green line) and catapulted at a distance from the cell with unfocused low-intensity laser beam (blue spot), which aseptically catapulted and isolated the single cell into the lid of a 0.2-mL PCR tube containing the cell lysis buffer. (D) Bright-field mode showing the section of the membrane where the single bacterium had been. (E) Fluorescence mode confirming that the bacterium of interest has been transferred from the membrane slide to the PCR tube lid.
Figure 2.
Figure 2.
Single-bacterium total transcript amplification strategy. This strategy is developed based on multiply primed rolling circle amplification of circularized cDNA using ϕ29 DNA polymerase. Blue boxes indicate DNA random hexamers, and pink boxes indicate RNA thiophosphate-linked random hexamers. The purpose and components of each step are indicated (for further details, see text). Abbreviations are as follows: aa-dUTP indicates 5-(3-aminoallyl)-2′-deoxyuridine-5′-triphosphate; dNTP, deoxyribonucleotide triphosphate; DpnI, restriction endonuclease from Diplococcus pneumoniae; EDTA, ethylenediaminetetraacetic acid; ϕ29 polymerase, DNA polymerase from a Bacillus subtilis phage Phi29; M, 1 kb DNA marker from New England BioLabs; McrBC, E. coli homing endonuclease; MMLV, Moloney murine leukemia virus reverse transcriptase; and ss-cDNA, single-stranded cDNA.
Figure 3.
Figure 3.
Fold-change scatter plots of expressed genes obtained from nonamplified versus amplified samples. 10–14 μg (A), 20–25 μg (B), or 30–35 μg (C) of DNA amplified from five-cell samples were hybridized to different slides, and the fold-changes of detected genes were plotted against those obtained from the nonamplified sample. The number located at the right bottom corner of each plot indicates the percentage of missing genes (drop-outs) from each amplified sample compared with the nonamplified sample (2842 genes total). (D) Gene expression levels from the nonamplified sample (black dots) were compared between two growth conditions (MG ± 0.01% GS). Expression levels of genes that were missing in the five-cell amplified samples are colored green (as a result of using 10–14 μg of cDNA), red (using 20–25 μg of cDNA), or purple (using 30–35 μg of cDNA), and are overlaid on the same graph in D. Similar comparisons were conducted with different amounts of cDNA amplified from one-cell samples: 10–14 μg (E), 20–25 μg (F), or 30–35 μg (G). Missing genes or drop-outs from each sample were color-coded similarly and overlaid with the total number of genes detected in the nonamplified samples (H). The R value in the upper left corner of each plot represents the Pearson correlation coefficient. All microarray experiments in this figure were conducted without the optional mRNA enrichment step.
Figure 4.
Figure 4.
Microarray data fold-change comparison of nonamplified and amplified samples starting from 2 pg of diluted RNA (A), five cells (B), or one cell (C) as biological replicates; or a single cell hybridized to three different slides as technical replicates (D). The first three plots of each item are biological replicates (A–C) or technical replicates (D). The number in the bottom right corner of each plot indicates the percentage of genes that were missing in the amplified samples compared to the nonamplified samples. The Pearson correlation coefficient between the amplified and nonamplified fold-change data is shown at the upper left corner of each plot. The high correlation coefficient values (P < 0.0001) and the tight grouping of the dots within the twofold difference boundaries suggest a relatively low bias. The percentages of overlap among missing genes from each group are displayed as area-proportional Venn diagrams of three independent biological (A–C) or technical replicates (D). The color for each circle in the Venn diagram corresponds to the colored boxes in each scatter plot. The last plot of each item shows averaged data from the three biological (A–C) or technical replicates (D). All microarray experiments in this figure were performed without the optional mRNA enrichment step.
Figure 5.
Figure 5.
Validation of microarray data via reporter-gene fusions. (A) Proposed amino acid metabolism pathways influenced by glyphosate (GS) in B. thailandensis. Two connecting arrows indicate two or more reaction steps. The target for GS is 5-enolpyruvylshikimate-3-phosphate synthase (EPSPS) (Fischer et al. 1986). In A, B, and C, green and orange boxes indicate genes induced and repressed, respectively, by GS. (B,C) gfp and lacZ reporters were fused to five GS-induced genes, three GS-repressed genes, and two GS-insensitive control genes (housekeeping gene controls in black boxes). (B) Cells were examined under 630 × magnification at 2 and 4 h post-exposure to GS. Differential interference contrast (DIC) and green fluorescence images were merged, and the representative fields are shown. (C) At the same time points, β-galactosidase activities for these fusion strains were determined in triplicate, and the Miller units were plotted with the SEM. The numbers above the bars in the histogram in C indicate fold-induction or fold-repression differences by GS, as measured by β-galactosidase assays. For comparison, the microarray data fold-change of the corresponding genes from the amplified sample and the nonamplified sample are also displayed below the graph. As a general trend, these gene-fusion data agree with the microarray data at both 2 and 4 h post-GS-exposure.
Figure 6.
Figure 6.
Evaluation of mRNA enrichment in amplified single cell samples. Top panel presents mRNA amount of a gene (BTH_I2028) relative to genes of 16S rRNA, 23S rRNA, and a tRNA-Ala detected by real-time RT-PCR. Unenriched represents amplified sample without the mRNA enrichment step. Enriched (1× or 10×) means treated with 1 × 10⁻⁵ U (as described in Methods) or 1 × 10⁻⁴ U of the Terminator 5′-Phosphate–Dependent Exonuclease, respectively. The relative transcriptional levels of rRNAs and tRNA are significantly higher than the BTH_I2028 gene (mRNA) in the unenriched sample but are greatly reduced in the enriched samples. Microarray analysis was performed for amplified samples (enriched and unenriched); fold-changes were compared to nonamplified samples as shown in the bottom plots. Fold-change correlation for the BTH_I2028 gene is indicated by the red dots. The number at the bottom right corner represents the percentage of transcripts that were missing in the single cell. Enrichment with 10× the amount of 5′-phosphate–dependent exonuclease resulted in a slightly higher fold-change bias as indicated by the Pearson correlation coefficient shown at the upper left corner for each plot.

Similar articles

Cited by

References

    1. Barrett AR, Kang Y, Inamasu KS, Son MS, Vukovich JM, Hoang TT 2008. Genetic tools for allelic replacement in Burkholderia species. Appl Environ Microbiol 74: 4498–4508 - PMC - PubMed
    1. Brett PJ, DeShazer D, Woods DE 1998. Burkholderia thailandensis sp. nov., description of Burkholderia pseudomallei-like species. Int J Syst Bacteriol 48: 317–320 - PubMed
    1. Croucher NJ, Fookes MC, Perkins TT, Turner DJ, Marguerat SB, Keane T, Quail MA, He M, Assefa S, Bahler J, et al. 2009. A simple method for directional transcriptome sequencing using Illumina technology. Nucleic Acids Res 37: e148 doi: 10.1093/nar/gkp811 - PMC - PubMed
    1. Emmert-Buck MR, Bonner RF, Smith PD, Chuaqui RF, Zhuang Z, Goldstein SR, Weiss RA, Liotta LA 1996. Laser capture microdissection. Science 274: 998–1001 - PubMed
    1. Fischer R, Berry A, Gaines CG, Jensen RA 1986. Comparative action of glyphosate as a trigger of energy drain in eubacteria. J Bacteriol 168: 1147–1154 - PMC - PubMed

Publication types

MeSH terms

Associated data