. 2011 May 1;25(9):930-45.
doi: 10.1101/gad.627811.

A novel function of the proneural factor Ascl1 in progenitor proliferation identified by genome-wide characterization of its targets

Affiliations

A novel function of the proneural factor Ascl1 in progenitor proliferation identified by genome-wide characterization of its targets

Diogo S Castro et al. Genes Dev. .

Abstract

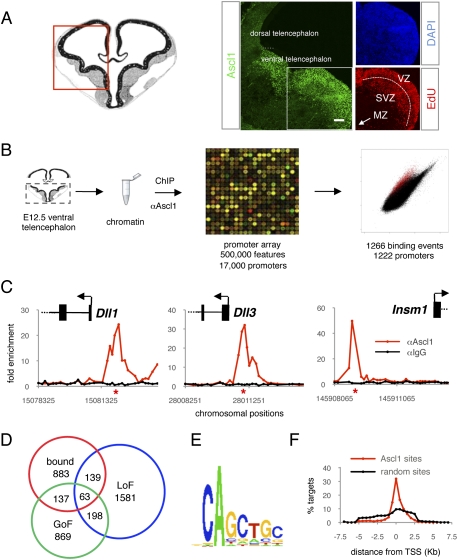
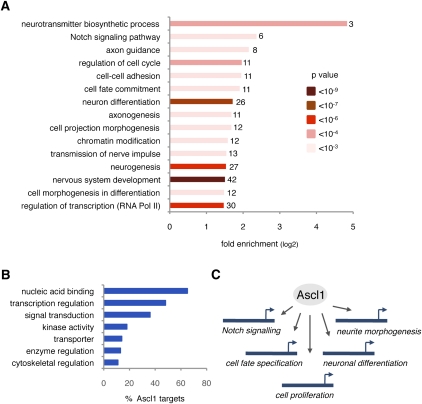
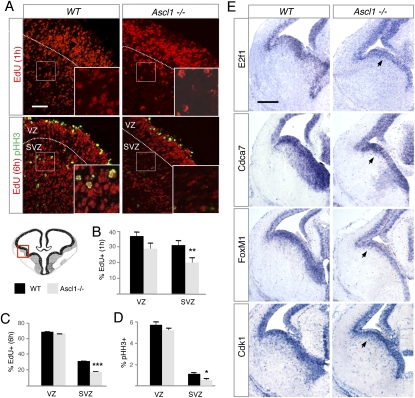
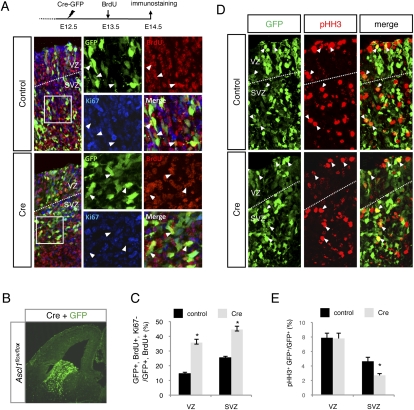
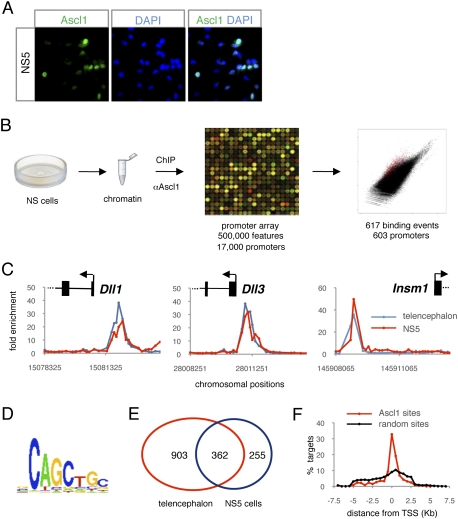
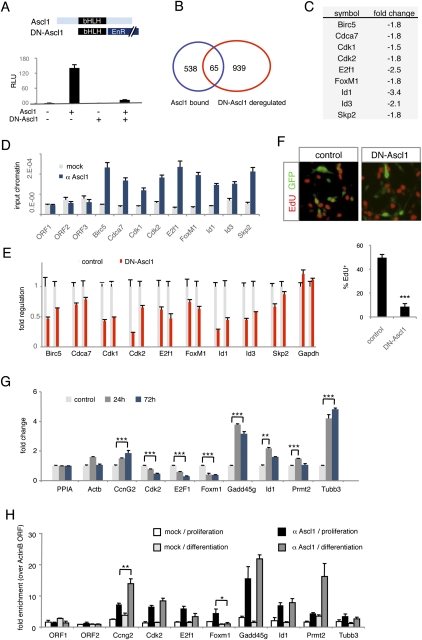
Proneural genes such as Ascl1 are known to promote cell cycle exit and neuronal differentiation when expressed in neural progenitor cells. The mechanisms by which proneural genes activate neurogenesis--and, in particular, the genes that they regulate--however, are mostly unknown. We performed a genome-wide characterization of the transcriptional targets of Ascl1 in the embryonic brain and in neural stem cell cultures by location analysis and expression profiling of embryos overexpressing or mutant for Ascl1. The wide range of molecular and cellular functions represented among these targets suggests that Ascl1 directly controls the specification of neural progenitors as well as the later steps of neuronal differentiation and neurite outgrowth. Surprisingly, Ascl1 also regulates the expression of a large number of genes involved in cell cycle progression, including canonical cell cycle regulators and oncogenic transcription factors. Mutational analysis in the embryonic brain and manipulation of Ascl1 activity in neural stem cell cultures revealed that Ascl1 is indeed required for normal proliferation of neural progenitors. This study identified a novel and unexpected activity of the proneural gene Ascl1, and revealed a direct molecular link between the phase of expansion of neural progenitors and the subsequent phases of cell cycle exit and neuronal differentiation.


Figures

Figure 1.
Figure 1.
Characterization of the transcriptional program regulated by Ascl1 in the ventral telencephalon. (A) Expression of Ascl1 (green) in E12.5 mouse ventral telencephalons detected by immunohistochemistry is confined to the proliferative zones (VZ and SVZ; their border is marked with a white dashed line). Labeling for EdU (red) 6 h after administration marks progenitor cells in G2/M phases of the cell cycle. The MZ, which contains post-mitotic neurons, is outside the enlarged area, as shown with the white arrow. All nuclei are labeled with DAPI (blue). The red rectangle in the left drawing indicates the area of the ventral telencephalon documented. The white square in the left panel indicates the area enlarged in the right panels. Bar, 150 μm. (B) DNA segments bound by Ascl1 in the ventral telencephalon were identified by ChIP with an Ascl1-specific antibody and hybridization to a promoter microarray (ChIP-on-chip). (C) Ascl1 binding to known target genes. The plots display ChIP enrichment ratios for Ascl1 (red) and control (black) samples for all probes in target promoters. Genes are shown to scale above the plots (exons represented as boxes and introns represented as lines) and genomic regions below the plots. Arrows indicate the transcription start site and direction of transcription. Red stars show the positions of previously validated Ascl1-binding sites. (D) Venn diagram showing the overlap between genes associated with Ascl1-binding events (red), genes deregulated in Ascl1 GOF experiments (green), and genes deregulated in Ascl1 LOF experiments (blue). The number of genes in each section of the diagram is indicated. (E) Motif enriched in Ascl1-bound segments from a de novo search using Trawler software. (F) Plot representing the fraction of Ascl1-binding events located at consecutive 0.5-kb intervals away from the transcription start site of target genes (red dots and line). A plot for a randomized sample of binding events is shown as control (black dots and line).
Figure 2.
Figure 2.
Ascl1 directly regulates different steps in the neurogenic program. (A) Enrichment of Gene Ontology biological process terms in Ascl1 target genes. Number of target genes in each category is shown. (B) Enrichment of Gene Ontology molecular function terms (GO Slim) in Ascl1 target genes. (C) Ascl1 directly binds and regulates genes associated with all of the major steps of neurogenesis.
Figure 3.
Figure 3.
Illustration of Ascl1 target genes with a predicted role in the regulation of progenitor cell divisions. (A) Promoter regions and expression patterns of selected Ascl1 targets that are expected to promote (names in blue) or inhibit (names in green) cell proliferation. The plots display ChIP enrichment ratios for Ascl1 (red) and control (black) samples in promoter regions. Black arrows indicate the transcription start site and direction of transcription. Blue arrowheads indicate the position of primers used for ChIP-PCR validation. The expression patterns on sagittal sections of an E14.5 mouse telencephalon are from the public in situ hybridization database GenePaint (http://www.genepaint.org). Note that many Ascl1 targets are expressed throughout the telencephalon but are likely to be regulated by Ascl1 only in the ventral telencephalon. (B) Validation of Ascl1-bound segments by ChIP-PCR on immunoprecipitated material from an E12.5 ventral telencephalon. ORF1–3 are negative control regions described in the Supplemental Material. Mean ± SEM; quantification in triplicate from at least two immunoprecipitations. (C) Ascl1 target genes promote progression through multiple phases of the cell cycle. The genes listed include Ascl1 targets in both embryonic telencephalon and NS5 cells. Genes in black and red encode TFs and other types of proteins, respectively. Arrowheads indicate the main cell cycle checkpoints (G1, G2, and metaphase).
Figure 4.
Figure 4.
Depletion of intermediate progenitors in the ventral telencephalon of Ascl1-null mutant embryos. (A) Immunolabeling of progenitor cells in E14.5 wild-type (WT) or Ascl1-null mutant (Ascl1−/−) embryos. Cells having incorporated EdU 1 h (S phase) or 6 h (M/early G1) after administration are labeled in red in the top and bottom panels, respectively. Cells expressing pHH3 (G2/M) are shown in green in the bottom panel. White dotted lines show the border between the VZ and SVZ, and small white rectangles show the areas enlarged in the insets. The red rectangle in the drawing below indicates the area of the ventral telencephalon illustrated. Bar, 50 μm. (B–D) Quantification of the fraction of cells having incorporated EdU 1 h (B) or 6 h (C) after administration or expressing pHH3 (D) in the VZ and SVZ of the ventral telencephalon in Ascl1-null mutant (gray bars) and wild-type (black bars) embryos. Mean ± SEM; (***) P < 0.001; (**) P < 0.01; (*) P < 0.05 with Student's t-test; n > 3000 cells for each condition; quantification from at least three sections from at least three embryos. (E) Expression of selected Ascl1 target genes with a predicted role in regulation of neural progenitor divisions, analyzed by in situ hybridization on frontal sections of ventral telencephalon from E14.5 wild-type and Ascl1-null mutant embryos. Arrowheads point to the domains of gene expression in the SVZ present in the wild-type and absent in the mutant embryo. Bar, 500 μm.
Figure 5.
Figure 5.
Reduced cell proliferation following acute deletion of Ascl1. (A) In utero electroporation of a control GFP vector (top panel) or a plasmid expressing Cre recombinase (bottom panel) together with GFP into the ventral telencephalon of E12.5 embryos carrying a conditional Ascl1-null mutant allele (Ascl1floxed), followed by BrdU administration at E13.5 and coimmunolabeling at E14.5 for GFP (green), BrdU (red), and Ki67 (blue). White dotted lines show the border between the VZ and SVZ, white arrowheads point to GFP+/BrdU+/Ki67 cells, and white rectangles show the areas enlarged in the insets. The design of the experiment is shown above the panels. Bar, 100 μm. (B) Illustration of an electroporated embryo labeled for GFP (green) showing extensive electroporation of the ventral telencephalon. (C) Quantification of the rate of cell cycle exit, corresponding to the fraction of electroporated cells cycling at E13.5 (GFP+/BrdU+) that are not dividing at E14.5 (GFP+/BrdU+/Ki67), in the VZ and SVZ of control and Cre electroporated embryos. Mean ± SEM; (**) P < 0.01 with Student's t-test; n > 300 for each condition; quantification from at least three sections from at least three embryos from three different litters. (D) Same experiment as in A, except that electroporated brain sections were colabeled for pHH3 and GFP. White arrowheads point to double-labeled cells. Bar, 50 μm. (E) Quantification of the fraction of GFP+ coexpressing pHH3 in the VZ or SVZ of control (black bars) or Cre electroporated (gray bars) embryos. Mean ± SEM; (*) P < 0.05 with Student's t-test; n > 1400 cells for each condition; quantification from four sections from at least three embryos from three different litters.
Figure 6.
Figure 6.
Genome-wide location analysis of Ascl1 in NS5 cells. (A) Expression of Ascl1 (green) in proliferating NS5 cells analyzed by immunocytochemistry. The nuclei of NS5 cells are labeled with DAPI (blue). (B) ChIP-on-chip analysis of DNA segments bound by Ascl1 in proliferating NS5 cells. (C) Ascl1 binding to known target genes. The plots display ChIP enrichment ratios for NS5 (black) and embryonic telencephalon (red) samples for all probes in target promoters. Genes are shown to scale above the plots and genomic regions are shown below the plots. Arrows indicate the transcription start site and direction of transcription. (D) Motif enriched in Ascl1-bound segments in NS5 cells from a de novo search using Trawler software. (E) Venn diagram showing the overlap in Ascl1 promoter occupancy data between the embryonic telencephalon (red) and NS5 cells (blue). (F) Plot representing the fraction of Ascl1-binding events located at consecutive 0.5-kb intervals away from the transcription start site of target genes (red dots and line). A plot for a randomized sample of binding events is shown as control (black dots and line).
Figure 7.
Figure 7.
A cell cycle regulatory module activated by Ascl1 in NS5 cells. (A) Ascl1-EnR acts as a dominant-negative version of Ascl1 in NS5 cells. The drawings depict wild-type Ascl1 and the Ascl1-EnR fusion protein containing the bHLH domain of Ascl1 (in black) and the Drosophila engrailed repressor domain (EnR, in dark blue). The graph shows the result of a transcriptional assay in which Ascl1-EnR blocks the transcriptional activity of wild-type Ascl1 in NS5 cells, measured by activation of a reporter construct expressing luciferase under the control of a multimerized Ascl1-binding site (E-box) and a minimal β-globin promoter. Mean ± SEM; n = 4. (B) Venn diagram showing the overlap between genes associated with an Ascl1-bound promoter (blue) and genes deregulated in an expression profiling analysis of DN-Ascl1-transfected NS5 cells (red). (C) Cell cycle regulators among Ascl1 target genes (bound by Ascl1 and deregulated by DN-Ascl1) and their respective fold changes in expression profiling analysis of DN-Ascl1-transfected cells compared with control vector-transfected cells. (D) Validation of Ascl1-bound segments by ChIP-PCR on immunoprecipitated material from NS5 cells. Mean ± SEM; quantification in triplicate from at least two immunoprecipitations. (E) Changes in expression levels of cell cycle target genes 24 h after transfection of NS5 cells with a control (black) or DN-Ascl1-expressing vector (red), quantified by real-time PCR. Mean ± SEM; n = 3. (F) Proliferation of NS5 cells expressing a control vector or DN-Ascl1 measured by the rate of EdU incorporation among transfected cells following exposure for a period of 9 h, 24 h after transfection. The pictures above the graph show labeling for EdU (red) and GFP (green) to mark cells transfected with the control vector (left) or Ascl1-EnR (right). Mean ± SEM; (***) P < 0.001 with Student's t-test; n = 6. (G) Change in expression levels of Ascl1 cell cycle targets in NS5 cells 24 and 72 h after induction of neuronal differentiation compared with proliferating NS5 cells (control) measured by real-time PCR. Mean ± SEM; n = 3. (H) Changes in Ascl1 binding to cell cycle targets in NS5 cells 48 h after induction of neuronal differentiation compared with proliferating NS5 cells, measured by ChIP-PCR. Mean ± SEM; (**) P < 0.01 with Student's t-test; n = 6.

References

    1. Alonso MM, Alemany R, Fueyo J, Gomez-Manzano C 2008. E2F1 in gliomas: a paradigm of oncogene addiction. Cancer Lett 263: 157–163 - PubMed
    1. Anderson SA, Qiu M, Bulfone A, Eisenstat DD, Meneses J, Pedersen R, Rubenstein JL 1997. Mutations of the homeobox genes Dlx-1 and Dlx-2 disrupt the striatal subventricular zone and differentiation of late born striatal neurons. Neuron 19: 27–37 - PubMed
    1. Arachchige Don AS, Dallapiazza RF, Bennin DA, Brake T, Cowan CE, Horne MC 2006. Cyclin G2 is a centrosome-associated nucleocytoplasmic shuttling protein that influences microtubule stability and induces a p53-dependent cell cycle arrest. Exp Cell Res 312: 4181–4204 - PMC - PubMed
    1. Ball DW 2004. Achaete-scute homolog-1 and Notch in lung neuroendocrine development and cancer. Cancer Lett 204: 159–169 - PubMed
    1. Bergsland M, Werme M, Malewicz M, Perlmann T, Muhr J 2006. The establishment of neuronal properties is controlled by Sox4 and Sox11. Genes Dev 20: 3475–3486 - PMC - PubMed

Publication types

MeSH terms

Substances