. 2011 May 9;208(5):1069-82.
doi: 10.1084/jem.20101709. Epub 2011 May 2.

Pretransplant CSF-1 therapy expands recipient macrophages and ameliorates GVHD after allogeneic hematopoietic cell transplantation

Affiliations

Pretransplant CSF-1 therapy expands recipient macrophages and ameliorates GVHD after allogeneic hematopoietic cell transplantation

Daigo Hashimoto et al. J Exp Med. .

Abstract

Acute graft-versus-host disease (GVHD) results from the attack of host tissues by donor allogeneic T cells and is the most serious limitation of allogeneic hematopoietic cell transplantation (allo-HCT). Host antigen-presenting cells are thought to control the priming of alloreactive T cells and the induction of acute GVHD after allo-HCT. However, whereas the role of host DC in GVHD has been established, the contribution of host macrophages to GVHD has not been clearly addressed. We show that, in contrast to DC, reducing of the host macrophage pool in recipient mice increased donor T cell expansion and aggravated GVHD mortality after allo-HCT. We also show that host macrophages that persist after allo-HCT engulf donor allogeneic T cells and inhibit their proliferation. Conversely, administration of the cytokine CSF-1 before transplant expanded the host macrophage pool, reduced donor T cell expansion, and improved GVHD morbidity and mortality after allo-HCT. This study establishes the unexpected key role of host macrophages in inhibiting GVHD and identifies CSF-1 as a potential prophylactic therapy to limit acute GVHD after allo-HCT in the clinic.


Figures

Figure 1.
Figure 1.
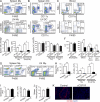
Macrophages persist in lymphoid tissues for several days after TBI. C57BL/6 mice were sacrificed 48 h (gray bars, n = 6) and 96 h (black bars, n = 6) after TBI (13 Gy). Nonirradiated C57BL/6 mice were used as controls (white bars, n = 4–8). The number of remaining host macrophages (A), DCs (B), and B cells (C) in the spleen (top) and mesenteric LN (bottom) are shown as mean ± SEM. Pooled data from two independent experiments are shown. Mϕ, macrophage.
Figure 2.
Figure 2.
Pretransplant anti–CSF-1R mAb (αCSF-1R) administration depletes remaining host lymphoid tissue macrophages. (A–F) Mice were injected with αCSF-1R (black bar, n = 11) or rat IgG (white bar, n = 9) for 3 d and were sacrificed 5 d after the last injection. The numbers of spleen and LN macrophages (A and D), spleen and LN DCs (B and E), and circulating neutrophils and monocytes (C and F) are shown. In the LN panel shown in A, dot plots show the percentage of LN macrophages among CD11b+ gated cells. Other dot plots depicted in A and B show percentage of DCs or macrophages among total spleen or LN cells. Data from three independent experiments are pooled and shown as mean ± SEM. *, P < 0.05; **, P < 0.001. (G–K) C57BL/6 mice were injected i.p. with αCSF-1R (black bar, n = 10) or isotype IgG (white bar, n = 7–11) from days −5 to −3, were lethally irradiated and reconstituted with allogeneic BM and splenocytes on day 0, and were then sacrificed 2 d later. The relative (G) and absolute (H) numbers of remaining host spleen and LN macrophages and the absolute numbers of spleen and LN DCs (I) and spleen neutrophils (J) are shown. Data from three independent experiments are combined and shown as mean ± SEM. *, P < 0.05; **, P < 0.001. (K) Images show frozen sections of spleens stained for CD169+ marginal zone metallophilic macrophages. Bars, 100 µm.
Figure 3.
Figure 3.
Anti–CSF-1R (αCSF-1R) mAb treatment exacerbates GVHD without impairing donor hematopoietic cell engraftment. (A and B) C57BL/6 mice (n = 5–6/group) were injected i.p. with αCSF-1R (solid lines, diamond) or control rat IgG (dashed lines, triangle) on days −5 to −3, lethally irradiated (13 Gy), and injected i.v. on day 0 with 2.5 (open symbols) or 10 (closed symbols) × 106 splenocytes plus 5 × 10⁶ BM cells isolated from BALB/c mice. As controls, syngeneic C57BL/6 CD45.2+ mice (open circle, n = 3/group) were treated with anti–CSF-1R (solid lines) or rat IgG (dashed lines) on days −5 to −3, lethally irradiated (13 Gy), and i.v. injected on day 0 with 2.5 × 10⁶ splenocytes plus 5 × 10⁶ BM cells isolated from C57BL/6 CD45.1+ congenic mice. Graphs show survival curves after transplant (A) and clinical GVHD scores reported as mean ± SEM (B). *, P < 0.005; **, P < 0.05 versus allogeneic rat IgG-treated groups. (C) H&E staining of liver (i, ii, and iii) and colon (iv, v, and vi) sections harvested 20 d after transplant from mice treated with αCSF-1R before syngeneic HCT (i and iv) or mice treated with rat IgG (ii and v) or αCSF-1R (iii and vi) before allo-HCT. Arrowheads show inflammatory infiltrates accumulating in liver tissue sections. Bars, 100 µm. (D) Pathological GVHD scores from syngeneic recipients (white bar, n = 6), allogeneic recipients treated with rat IgG (gray bar, n = 6), and allogeneic recipients treated with αCSF-1R (black bar, n = 6) are shown as mean ± SEM. Scores were analyzed on day 20 after transplant and calculated as the sum of the scores of liver, small intestine, and colon. *, P < 0.005. (E–G) White blood cells in peripheral blood were counted and analyzed by flow cytometry 11 d after allo-HCT. Percent donor chimerism among myeloid and lymphoid subsets (E), absolute numbers of total blood leukocytes (F), and circulating CD11b+ myeloid cells (G) are shown. Horizontal bars indicate mean. Data from one of two similar experiments were shown.
Figure 4.
Figure 4.
Pretransplant anti–CSF-1R mAb (αCSF1R) injection enhances donor T cell expansion through its effect on host CSF-1R–expressing cells. (A–F) C57BL/6 mice were treated with αCSF-1R (black bars, n = 10) or control rat IgG (gray bars, n = 13) on days −5 to −3, lethally irradiated, and i.v. injected on day 0 with 5 × 10⁶ splenocytes plus 5 × 10⁶ BM cells isolated from BALB/c mice. Absolute numbers of spleen, LN, and liver donor T cells identified as H2Kd+TCRβ+CD4+ or H2Kd+TCRβ+CD8+ cells (A–C) and serum cytokine levels (pg/ml; D–F) measured on day 6 after transplant are shown as mean ± SEM. Data were pooled from three independent experiments. (G–L) C57BL/6 CD45.2+ mice were injected i.p. with αCSF-1R mAb on days −5 to −3, lethally irradiated, and injected on day 0 with 2 × 10⁶ purified T cells isolated from congenic C57BL/6 CD45.1+ mice (G–I) or allogeneic BALB/c mice (J–L). Absolute numbers of donor T cells in the spleen, mesenteric LN, and liver analyzed on day 5 after transfer are shown as mean ± SEM. Data were pooled from two independent experiments. *, P < 0.05; **, P < 0.005.
Figure 5.
Figure 5.
Lip-Clod administered 10 d before allo-HCT exacerbates acute GVHD through the specific depletion of host macrophages. (A) Dot plots show the relative number of DC and macrophages among total splenocytes in C57BL/6 mice that were untreated or injected with 100 µl Lip-Clod and analyzed 2 or 10 d after injection. (B) The absolute numbers of splenic macrophages and DC in Lip-Clod–treated mice (black bars, n = 5) and control mice (white bar, n = 5) are shown as mean ± SEM. Data from one of two similar experiments were shown. (C and D) C57BL/6 mice were injected with 100 µl Lip-Clod (solid lines, diamonds) or PBS (dashed lines, triangles) 10 d before allo-HCT. Graphs show survival curves (C) and clinical GVHD scores presented as mean ± SEM (D). *, P < 0.05. Data are pooled from two independent experiments.
Figure 6.
Figure 6.
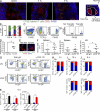
Macrophages reduce the survival of allogeneic T cells before the initiation of T cell proliferation (A–F) C57BL/6 T cells (A and C), BALB/c T cells (B, D, and E), or BALB/c B cells (F) were co-cultured with C57BL/6 DC in the presence or absence of splenic (A, B, and F) or peritoneal (C and E) macrophages from C57BL/6 mice. In D, DC and macrophages were purified from BALB/c mice. Graphs show the survival index of remaining live T cells or B cells after 44 h of culture in the presence of macrophages. The survival index was calculated as the ratio of remaining live lymphocytes in each well to the mean of numbers of live lymphocytes in the wells without macrophages. Horizontal bars indicate mean. (G) BALB/c T cells were labeled with 5 µM CFSE before co-culture with C57BL/6 DC in the presence or absence of C57BL/6 macrophages. CFSE dilution within TCR-β–positive cells was analyzed after 48 h of culture. (H) Images show macrophages isolated after 18 h of in vitro co-culture (as described in G) contained CFSE+ material. Bars, 10 µm. (I and J) DCs and macrophages purified from C57BL/6 mice were cultured with or without PKH26-labeled BALB/c T cells. Phagocytosis of PKH26-labeled T cells by DC and macrophages were evaluated after 2 and 6 h of co-culture. (I) Dot plot shows the gating strategy for DC and macrophages. Doublets and dead cells were excluded from the analysis. Histograms show the presence of PKH26+ material in gated DC (top) and macrophages (bottom) cultured with (red lines) or without (blue shaded area) PKH26-labeled T cells. (J) The percentage of PKH26-positive cells among DCs (white bar) and macrophages (black bar) after 2 and 6 h of co-culture are shown as mean ± SEM. B6, C57BL/6. *, P < 0.05. These results were representative of three independent experiments.
Figure 7.
Figure 7.
Host macrophages reduce the donor T cell pool partly though their ability to clear donor allogeneic T cells after allo-HCT. (A and B) Lethally irradiated C57BL/6 mice were injected with 6 × 10⁶ CFSE-labeled BALB/c T cells. Sequential lengthwise frozen sections of whole spleens were made at the indicated time points after transfer. The section with maximal area was chosen and stained with anti-F4/80 (blue) and anti-CD3 (red) mAb. (A) Representative images at each time points are shown. The far right panel indicates that the F4/80-positive area and CD3ε-positive area are defined as red pulp and T cell zone, respectively and the unstained area is defined as marginal zone or B cell follicle. Bars, 500 µm. (B) Images of the whole sections were captured using an automatic motorized stage. CFSE+ T cells in each area were counted separately. The percentage of CFSE-labeled T cells in T cell zone (red), red pulp (blue), and marginal zone or B cell follicle (green) are shown as mean ± SEM. (C and D) Lethally irradiated C57BL/6 mice were injected with 3 × 10⁶ CFSE-labeled BALB/c T cells and sacrificed 1–2 h after transfer. Dot plots (C) show the gating strategy for recipient red pulp macrophages. The percentages of host macrophages that phagocytosed CFSE+ cells (D) upon adoptive transfer of CFSE+ T cells (filled circle) or noninjected controls (open circle) are shown. Data from one out of two separate experiments are shown. (E) Representative images of F4/80+ macrophages that engulfed CFSE-labeled T cells at 18 h after the transfer are shown. Bars, 10 µm. (F) B6 mice were treated with αCSF-1R (filled circles) or rat IgG (open circles) from days −5 to −3 and lethally irradiated and injected with 5 × 10⁶ CFSE-labeled splenocytes and 5 × 10⁶ CFSE-labeled BM cells on day 0. The absolute numbers of donor cells that accumulate in the recipient spleen 18 h after transfer are shown. Pooled data from three independent experiments were combined. Horizontal bars indicate mean. (G–K) BALB/c mice were treated with αCSF-1R or rat IgG from days −5 to −3. On day 0, the recipient mice were lethally irradiated and injected with 3 × 10⁶ wild-type T cell–depleted BM cells together with 106 CD45.2+ B6 CD47 knockout (KO) T cells and 106 CD45.1+ B6 WT T cells. (G) Dot plot show the percentage of donor allogeneic CD47 KO T cells identified as CD45.1H2-Kb+TCR-β+ cells and donor WT T cells identified as CD45.1+H2-Kb+TCR-β+ cells in allogeneic recipient mice on day 6 after allo-HCT. (H–J) The percentages of CD47 KO T cells (red) and WT T cells (blue) among donor allogeneic T cells in recipient mice sacrificed at 2 h (H, n = 2/group), 18 h (I, n = 4/group), or 6 d (J, n = 5/group) after allo-HCT are shown as mean ± SEM. (K) Absolute number of donor T cells in allogeneic recipients analyzed 6 d after transfer are shown as mean ± SEM. *, P < 0.05. The results are representative of two independent experiments. MZ, marginal zone; RPM, red pulp macrophage. *, P < 0.05.
Figure 8.
Figure 8.
CSF-1 administration reduces donor T cell expansion and GVHD severity. (A) C57BL/6 mice were injected i.p. with 106 U human CSF-1 (black bar, n = 11) or diluent (white bar, n = 11) daily for 5 d and transplanted with 5 × 10⁶ splenocytes and 5 × 10⁶ BM cells 1 d after the last injection. Splenic macrophages were enumerated 24 h after the transplant and shown as mean ± SEM. Data from three separate experiments were combined. (B–F) C57BL/6 mice were treated with CSF-1 (black bar, n = 12) or diluent (white bar, n = 12) and transplanted as in A. Bar graphs show the number of donor T cells in the spleen (B), mesenteric LN (C), and liver (D) and the number of IFN-γ–producing T cells (E) and Foxp3+ T regulatory cells in the mesenteric LN (F) on day 6 after transplant. Data are shown as mean ± SEM. (G–K) C57BL/6 mice were treated with CSF-1 (diamonds, solid lines) or diluent (triangles, dashed lines) for 5 d and injected with 10 × 106 (G, H, and K, n = 10/group) or 20 × 106 (I and J, n = 5–6/group) splenocytes plus 5 × 10⁶ BM cells isolated from BALB/c donors 1 d after the last CSF-1 injection. As controls, recipient mice were reconstituted with syngeneic BM cells and splenocytes (G, filled circles, n = 3). Survival curves (G and I) and clinical GVHD scores (H and J) are shown. (K) The numbers of thymic CD4+ CD8+ double-positive cells from diluent-treated (gray bar) and CSF-1–treated (black bar) recipients were enumerated on day 22 and shown as mean ± SEM. As control, the data from syngeneic recipients (white bar, n = 3) were shown. Data were pooled from two independent experiments. *, P < 0. 05; *, P < 0.0001 versus diluent-treated controls

Similar articles

Cited by

References

    1. Abe M., Cheng J., Qi J., Glaser R.M., Thall A.D., Sykes M., Yang Y.-G. 2002. Elimination of porcine hemopoietic cells by macrophages in mice. J. Immunol. 168:621–628 - PubMed
    1. Allavena P., Sica A., Garlanda C., Mantovani A. 2008. The Yin-Yang of tumor-associated macrophages in neoplastic progression and immune surveillance. Immunol. Rev. 222:155–161 10.1111/j.1600-065X.2008.00607.x - DOI - PubMed
    1. Alyea E., Weller E., Schlossman R., Canning C., Webb I., Doss D., Mauch P., Marcus K., Fisher D., Freeman A., et al. 2001. T-cell—depleted allogeneic bone marrow transplantation followed by donor lymphocyte infusion in patients with multiple myeloma: induction of graft-versus-myeloma effect. Blood. 98:934–939 10.1182/blood.V98.4.934 - DOI - PubMed
    1. Banovic T., MacDonald K.P., Morris E.S., Rowe V., Kuns R., Don A., Kelly J., Ledbetter S., Clouston A.D., Hill G.R. 2005. TGF-beta in allogeneic stem cell transplantation: friend or foe? Blood. 106:2206–2214 10.1182/blood-2005-01-0062 - DOI - PubMed
    1. Bartocci A., Mastrogiannis D.S., Migliorati G., Stockert R.J., Wolkoff A.W., Stanley E.R. 1987. Macrophages specifically regulate the concentration of their own growth factor in the circulation. Proc. Natl. Acad. Sci. USA. 84:6179–6183 10.1073/pnas.84.17.6179 - DOI - PMC - PubMed

Publication types

Substances