. 2011 May 9;208(5):987-99.
doi: 10.1084/jem.20101773. Epub 2011 May 2.

Viral persistence redirects CD4 T cell differentiation toward T follicular helper cells

Affiliations

Viral persistence redirects CD4 T cell differentiation toward T follicular helper cells

Laura M Fahey et al. J Exp Med. .

Abstract

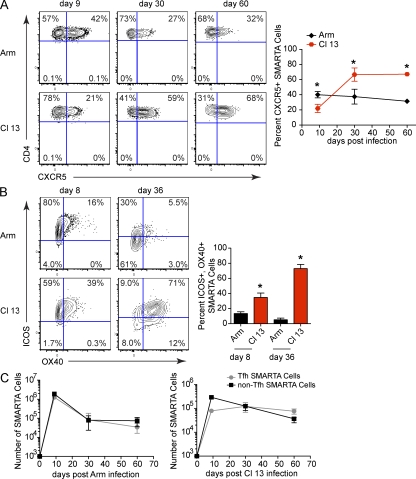
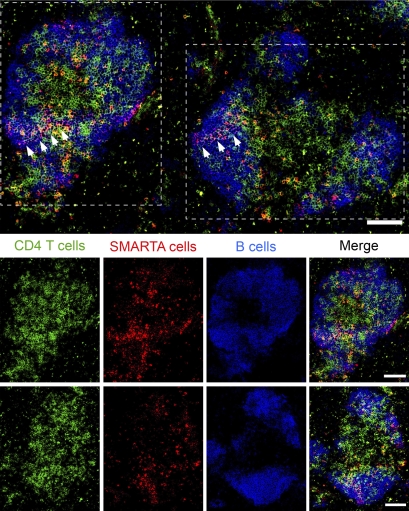
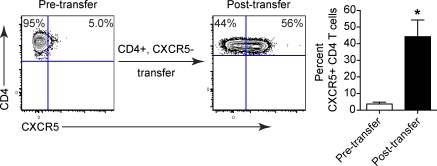
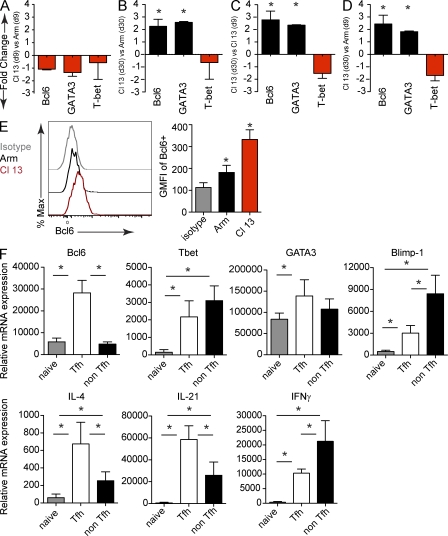
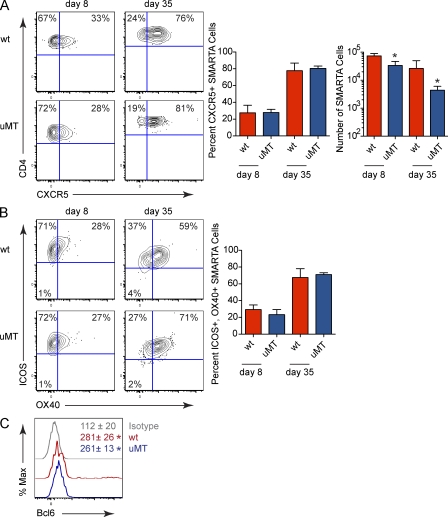
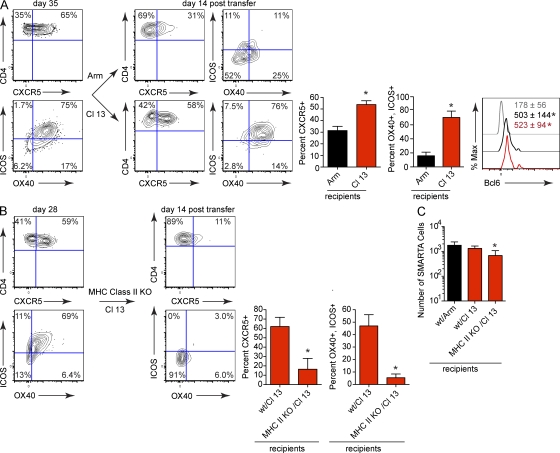
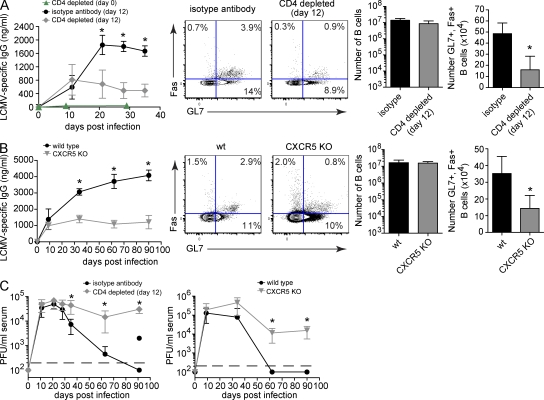
CD4 T cell responses are crucial to prevent and control viral infection; however, virus-specific CD4 T cell activity is considered to be rapidly lost during many persistent viral infections. This is largely caused by the fact that during viral persistence CD4 T cells do not produce the classical Th1 cytokines associated with control of acute viral infections. Considering that CD4 T cell help is critical for both CD8 T cell and B cell functions, it is unclear how CD4 T cells can lose responsiveness but continue to sustain long-term control of persistent viral replication. We now demonstrate that CD4 T cell function is not extinguished as a result of viral persistence. Instead, viral persistence and prolonged T cell receptor stimulation progressively redirects CD4 T cell development away from the Th1 response induced during an acute infection toward T follicular helper cells. Importantly, this sustained CD4 T cell functionality is critical to maintain immunity and ultimately aid in the control of persistent viral infection.


Figures

Figure 1.
Figure 1.
Tfh differentiation during viral persistence. (A) Virus-specific (SMARTA) CD4 T cells were isolated from the spleen on day 9, 30, and 60 after LCMV-Arm or Cl 13 infection and were analyzed for the surface expression of CXCR5. The line graph indicates the percentage ± SD of CXCR5+ SMARTA cells during LCMV-Arm (black, diamond) and Cl 13 (red, octagons) infection on day 9, 30, and 60. (B) SMARTA cells were isolated from the spleen on day 8 and 36 after LCMV-Arm or Cl 13 infection and were analyzed for the surface expression of ICOS and OX40. The bar graph depicts the percentage ± SD of ICOS+, OX40+ SMARTA cells during LCMV-Arm (black) and Cl 13 (red) infection on the indicated days. (C) The line graph indicates the number of Tfh SMARTA cells (CXCR5+; gray circles) and non-Tfh SMARTA cells (CXCR5; black squares) during LCMV-Arm (left) and Cl 13 (right) infection. Data are representative of three to five mice per group and of four individual experiments (*, P < 0.05).
Figure 2.
Figure 2.
Virus-specific CD4 T cells traffic to B cell areas during persistent viral infection. Day 30 LCMV-Cl 13–infected spleen sections were stained with antibodies to CD4 (green), CD45.1 (SMARTA cells; red), and B220 (B cells; blue). The top row is a merged image illustrating the location of all the three cell types. The white arrows in the image indicate SMARTA cells within B cell areas. The bottom two rows depict the two follicular-like structures outlined with white dotted lines in the top image. The last row depicting a follicular-like structure is rotated 90 degrees relative to the top image. The first column represents total CD4 T cells, the second column represents virus-specific SMARTA cells, the third column represents total B cells, and the last column is a merged image. The scale bar within each image corresponds to 100 µm. The image is representative of 5–13 different CD4 T cells cell areas per spleen and 5 individual spleens.
Figure 3.
Figure 3.
Persistent viral replication drives non-Tfh cells to differentiate into Tfh cells. SMARTA cells were transferred into WT mice and subsequently infected with LCMV-Cl 13. CD4+, CXCR5 (non-Tfh) cells were isolated on day 9 after infection and transferred into WT mice that had been infected with LCMV-Cl 13 (but that had not received SMARTA cells). The contour plots depict CXCR5 expression on sorted CD4 T cells pretransfer (left) and SMARTA cells in the spleen 14 d after transfer (i.e., 23 d after infection) into LCMV-Cl 13–infected recipients. The bar graph depicts the percentage ± SD of CXCR5+, CD4 T cells before transfer (left) and after transfer (right). These data are representative of two individual experiments containing four mice each (*, P < 0.05).
Figure 4.
Figure 4.
Persistent viral infection induces Tfh transcriptional master regulators. SMARTA cells were FACS isolated from splenocytes on day 9 and 30 after LCMV-Arm or Cl 13 infection. mRNA expression was analyzed by quantitative RT-PCR. The results are presented as mean fold change in expression ± SD between SMARTA cells isolated from (A) LCMV-Cl 13 versus LCMV-Arm on day 9 after infection, (B) LCMV-Cl 13 versus LCMV-Arm on day 30 after infection, (C) LCMV-Cl 13 on day 30 versus day 9 after infection, or (D) LCMV-Cl 13 on day 30 versus LCMV-Arm on day 9 after infection. Data are representative of four mice per group and two individual experiments (*, P < 0.05). (E) The histogram illustrates Bcl6 expression in SMARTA cells on day 30 after LCMV-Arm (black) and Cl 13 infection (red). The gray line represents the isotype control. The bar graph on the right depicts the GMFI ± SD of Bcl6 in SMARTA cells. Data are representative of four to five mice per group and three separate experiments (*, P < 0.05). (F) mRNA expression was analyzed by quantitative RT-PCR from naive virus-specific CD4 T cells (SMARTA), splenic Tfh (CD4+, Ly5.1+, CXCR5+), and non-Tfh (CD4+, Ly5.1+, CXCR5) SMARTA cells sorted 30 d after LCMV-Cl 13 infection. The results are presented as the mean relative mRNA expression ± SD. Data are representative of four to five groups (each group consisting of sorted cells from five to six mice) and two to three separate experiments. Note, IL-4 data are presented from one experiment containing five groups (each group consisting of sorted cells from five mice; *, P < 0.05).
Figure 5.
Figure 5.
B cell–independent Tfh development during persistent viral infection. (A) The flow plots illustrate CXCR5 expression on SMARTA cells from LCMV-Cl 13–infected WT or μMT mice. The left bar graphs indicate the percentage ± SD of CXCR5 + SMARTA cells and the right bar graph depicts the absolute number ± SD of SMARTA cells. (B) The flow plots show ICOS and OX40 expression on SMARTA cells from LCMV-Cl 13–infected WT or μMT mice. Bar graphs indicate the percentage ± SD of ICOS+, OX40+ SMARTA cells. (C) The histogram depicts Bcl6 expression within SMARTA cells isolated from WT (red) and μMT (blue) mice 30 d after LCMV-Cl 13 infection. The gray line represents the isotype control. Numbers indicate the mean GMFI ± SD of Bcl6. Data are representative of three to four mice per group and three individual experiments (*, P < 0.05).
Figure 6.
Figure 6.
Sustained TCR stimulation drives Tfh differentiation during persistent viral infection. (A) SMARTA cells from LCMV-Cl 13–infected WT mice (left) were isolated on day 35 after infection and transferred into WT mice that had been infected with LCMV-Arm or Cl 13 35 d earlier (but that had not received SMARTA cells). The contour plots depict CXCR5, ICOS, and OX40 expression on SMARTA cells pretransfer (left) and 14 d after transfer into LCMV-Arm immune (top right) or LCMV-Cl 13–infected (bottom right) recipients. The bar graphs indicate the percentage ± SD of CXCR5+ or ICOS+, OX40+ SMARTA cells. The histogram illustrates Bcl6 expression in SMARTA cells 14 d after transfer into LCMV-Arm (black) and Cl 13 infection (red). The gray line represents the isotype control. Numbers indicate the mean GMFI ± SD of Bcl6 in each population. These data are representative of 4–6 mice per group and three individual experiments (*, P < 0.05). (B) SMARTA cells from LCMV-Cl 13–infected WT mice (left) were isolated on day 27 after infection and transferred into LCMV-Cl 13–infected WT C57BL6 or LCMV-Cl 13–infected MHC class II KO mice (all recipient mice were infected in parallel but had not received SMARTA cells). The contour plots illustrate CXCR5, ICOS and OX40 expression on SMARTA cells pretransfer (left panel) and fourteen days after transfer into LCMV-Cl 13–infected MHC Class II KO recipients (right). Bar graphs indicate the percentage ± SD of CXCR5+ or ICOS+, OX40+ SMARTA cells (*, P < 0.05). Data are representative of 3–5 mice per group and two individual experiments (C) The bar graph indicates the number ± SD of SMARTA cells in the spleen fourteen days after transfer. Data are representative of three to five mice per group and two individual experiments (*, P < 0.05).
Figure 7.
Figure 7.
Tfh cell development is required to sustain LCMV-specific B cell responses during persistent viral infection. (A) Antiviral B cell responses during LCMV-Cl 13 infection in isotype antibody control treated mice versus day 0 or 12 CD4-depleted WT mice. The line graph depicts the serum concentration (nanogram/milliliter) ± SD of LCMV-specific IgG produced by mice injected with isotype control antibody (black circles), or mice depleted of CD4 T cells on day 0 (green triangles) or day 12 (gray diamonds) on the indicated day after infection. Flow plots illustrate the frequency of GC B cells (GL7+, Fas+ B cells) on day thirty-five after infection. The bar graphs indicate the number ± SD of total B cells (left bar graph) and GC B cells (right bar graph) during persistent LCMV-Cl 13 infection. (B) Antiviral B cell responses during LCMV-Cl 13 infection in WT (black, circles) versus CXCR5 KO mice (gray, inverted triangles). The same analyses were performed as described in A. (C) Serum viral titers after LCMV-Cl 13 infection of isotype antibody control (black, circles) versus day 12 CD4-depleted (gray, diamonds) mice (left) or WT (black, circles) versus CXCR5 KO (gray, inverted triangles) mice (right). Data are expressed as PFU per milliliter serum ± SD. The black, dashed line indicates the lower limit of detection (200 PFU/ml). Data are representative of three to six mice per group and three individual experiments (*, P < 0.05).

References

    1. Barber D.L., Wherry E.J., Masopust D., Zhu B., Allison J.P., Sharpe A.H., Freeman G.J., Ahmed R. 2006. Restoring function in exhausted CD8 T cells during chronic viral infection. Nature. 439:682–687 10.1038/nature04444 - DOI - PubMed
    1. Battegay M., Moskophidis D., Rahemtulla A., Hengartner H., Mak T.W., Zinkernagel R.M. 1994. Enhanced establishment of a virus carrier state in adult CD4+ T-cell-deficient mice. J. Virol. 68:4700–4704 - PMC - PubMed
    1. Bergthaler A., Flatz L., Verschoor A., Hegazy A.N., Holdener M., Fink K., Eschli B., Merkler D., Sommerstein R., Horvath E., et al. 2009. Impaired antibody response causes persistence of prototypic T cell-contained virus. PLoS Biol. 7:e1000080 10.1371/journal.pbio.1000080 - DOI - PMC - PubMed
    1. Brooks D.G., Teyton L., Oldstone M.B., McGavern D.B. 2005. Intrinsic functional dysregulation of CD4 T cells occurs rapidly following persistent viral infection. J. Virol. 79:10514–10527 10.1128/JVI.79.16.10514-10527.2005 - DOI - PMC - PubMed
    1. Brooks D.G., McGavern D.B., Oldstone M.B. 2006a. Reprogramming of antiviral T cells prevents inactivation and restores T cell activity during persistent viral infection. J. Clin. Invest. 116:1675–1685 10.1172/JCI26856 - DOI - PMC - PubMed

Publication types

MeSH terms