

Unexpected patterns of fisheries collapse in the world's oceans
- PMID: 21536889
- PMCID: PMC3100948
- DOI: 10.1073/pnas.1015313108
Unexpected patterns of fisheries collapse in the world's oceans
Abstract
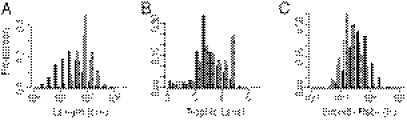
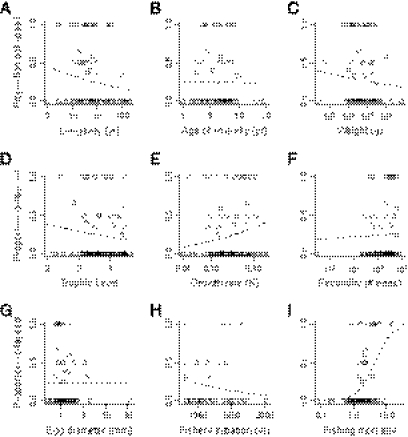
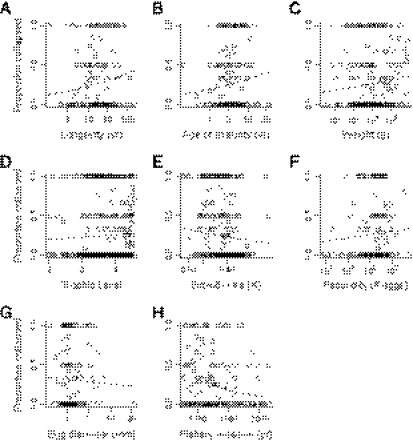
Understanding which species are most vulnerable to human impacts is a prerequisite for designing effective conservation strategies. Surveys of terrestrial species have suggested that large-bodied species and top predators are the most at risk, and it is commonly assumed that such patterns also apply in the ocean. However, there has been no global test of this hypothesis in the sea. We analyzed two fisheries datasets (stock assessments and landings) to determine the life-history traits of species that have suffered dramatic population collapses. Contrary to expectations, our data suggest that up to twice as many fisheries for small, low trophic-level species have collapsed compared with those for large predators. These patterns contrast with those on land, suggesting fundamental differences in the ways that industrial fisheries and land conversion affect natural communities. Even temporary collapses of small, low trophic-level fishes can have ecosystem-wide impacts by reducing food supply to larger fish, seabirds, and marine mammals.
Conflict of interest statement
The authors declare no conflict of interest.
Figures
References
-
- Worm B, et al. Rebuilding global fisheries. Science. 2009;325:578–585. - PubMed
-
- Fisher DO, Owens IPF. The comparative method in conservation biology. Trends Ecol Evol. 2004;19:391–398. - PubMed
-
- Cardillo M, et al. Multiple causes of high extinction risk in large mammal species. Science. 2005;309:1239–1241. - PubMed
-
- Myers RA, Worm B. Rapid worldwide depletion of predatory fish communities. Nature. 2003;423:280–283. - PubMed
-
- Baum JK, et al. Collapse and conservation of shark populations in the Northwest Atlantic. Science. 2003;299:389–392. - PubMed
Publication types
MeSH terms
LinkOut - more resources
Full Text Sources
Other Literature Sources
