. 2011 May 17;108(20):8473-8.
doi: 10.1073/pnas.1100428108. Epub 2011 May 2.

Fluctuating and sensory-induced vasodynamics in rodent cortex extend arteriole capacity

Affiliations

Fluctuating and sensory-induced vasodynamics in rodent cortex extend arteriole capacity

Patrick J Drew et al. Proc Natl Acad Sci U S A. .

Abstract

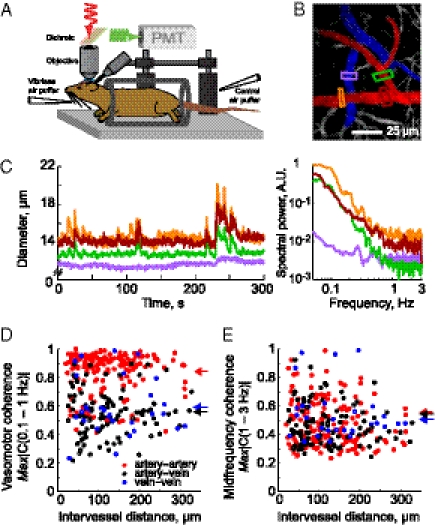
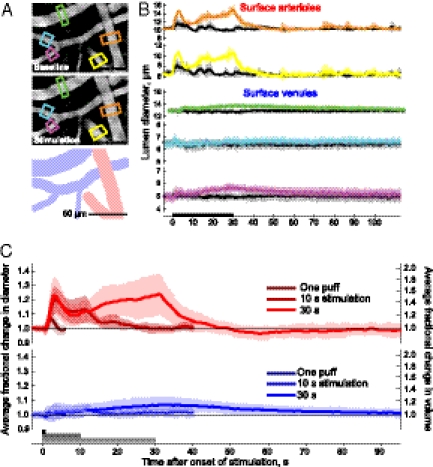
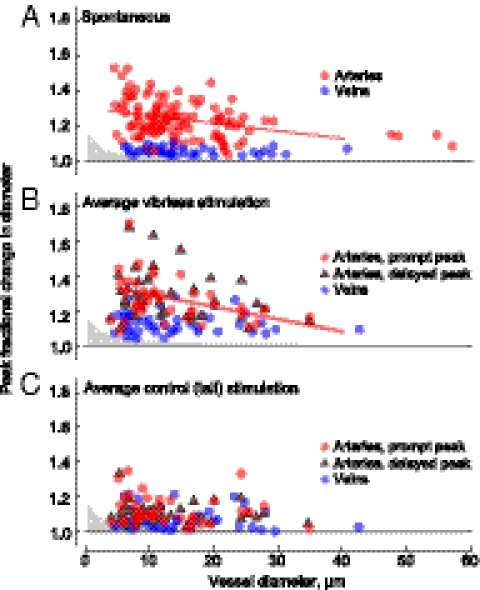
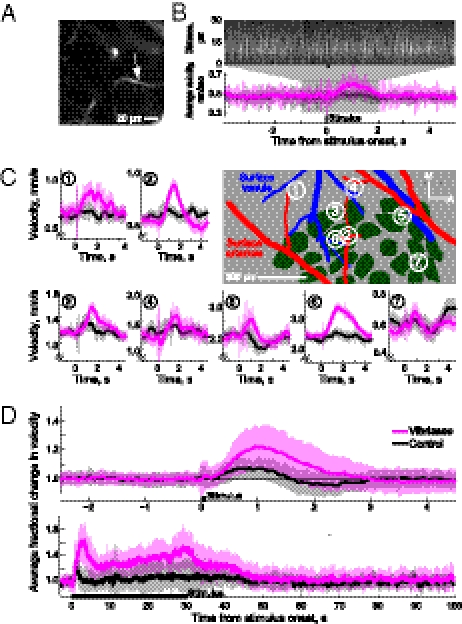
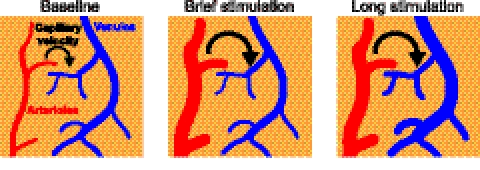
Neural activity in the brain is followed by localized changes in blood flow and volume. We address the relative change in volume for arteriole vs. venous blood within primary vibrissa cortex of awake, head-fixed mice. Two-photon laser-scanning microscopy was used to measure spontaneous and sensory evoked changes in flow and volume at the level of single vessels. We find that arterioles exhibit slow (<1 Hz) spontaneous increases in their diameter, as well as pronounced dilation in response to both punctate and prolonged stimulation of the contralateral vibrissae. In contrast, venules dilate only in response to prolonged stimulation. We conclude that stimulation that occurs on the time scale of natural stimuli leads to a net increase in the reservoir of arteriole blood. Thus, a "bagpipe" model that highlights arteriole dilation should augment the current "balloon" model of venous distension in the interpretation of fMRI images.


Conflict of interest statement

The authors declare no conflict of interest.

Figures

Fig. 1.
Fig. 1.
Basic setup and spontaneous vascular dynamics in the cortex of awake mouse. (A) Schematic of the experimental setup. The awake mouse is head-fixed by means of a bolt and sits passively in an acrylic cylinder beneath the two-photon microscope. Air puffers for sensory stimulation are aimed at the vibrissa and as a control at the tail. (B) Example image of surface vessels. Arteries are highlighted in red, veins in blue. Colored boxes show regions where vessel diameter is measured. The intensity has been logarithmically compressed. (C) Left: Plot of vessel diameters of a quietly resting mouse from a representative 5-min span. Right: Power spectrum of the fluctuations in diameter of same vessels. Colors indicate the location of the segment of the vessel shown in B. (D) Plot of the maximal magnitude of the spectral coherence, |C(f)|, between pairs of vessels for 0.1- to 1-Hz band; bandwidth typically 0.1 Hz. Arteriole-to-arteriole |C| = 0.84 ± 0.15 (mean ± SD), 198 pairs (red). Venue-to-venule |C| = 0.58 ± 0.20, 33 pairs (blue). Arteriole-to-venule |C| = 0.55 ± 0.16, 124 pairs (black). Filled circles are for significant (P < 0.01; inverse of twice the number of degrees of freedom) values, hollow circles for nonsignificant values. Arrows on right indicate mean values across types of pairs. (E) Plot of the maximal magnitude of the spectral coherence between pairs of vessels for the 1- to 3-Hz band; 0.1 Hz bandwidth. Filled circles are for significant coherences, hollow circles for nonsignificant. Arteriole-to-arteriole |C| = 0.54 ± 0.10 (red). Venue-to-venule |C| = 0.51 ± 0.07 (blue). Arteriole-to-venule |C| = 0.54 ± 0.08 (black).
Fig. 2.
Fig. 2.
Sensory evoked dilation of surface vessels. (A) Baseline image of vessels averaged 3–5 s before start of stimulation and the same vessels averaged 25–27 s after stimulus onset. Intensity has been logarithmically compressed. Illustration shows the location of veins and arteries in images. (B) Time course of the diameters of arterioles and venules in response to stimulation. Colored lines are in response to vibrissa stimulation, with the color indicating location of the diameter measurement in A; gray lines are control stimuli. Error bars indicate SD. (C) Normalized population volume changes (mean ± SD) for arterioles (Upper) and venules (Lower) for single puffs (28 arterioles and 7 veins), 10 s of puffs (17 arterioles and 8 venules), and 30 s of puffs (39 arterioles and 45 venules).
Fig. 3.
Fig. 3.
Relationship between peak value of the dilation and vessel diameter. (A) Plot of peak spontaneous dilations for arteries, in red, and veins, in blue. Gray area shows the 0.2-μm resolution limit of detectable changes. The line shows the linear regression for arterioles, with a slope of −0.004 μm−1 (r2 = 0.13, P < 0.001), whereas the slope for veins (not shown) is not significantly different from zero. (B) Plot of peak averaged dilation responses to 30-s vibrissae stimulation. Early arterial peaks, in the 0- to 10-s interval after stimulation, are denoted by red circles; regression slope = 0.007 μm−1 (r2 = 0.15, P < 0.02). Late arterial peaks, more than 10 s after onset, are denoted by red triangles; the linear regression (not shown) is not significant. Venuoles are denoted by blue dots; the linear regression is not significant. (C) Response to control stimulation. Note that spontaneous events had negligible contribution to the estimate of stimulus-induced events in B and C.
Fig. 4.
Fig. 4.
Velocity increases caused by sensory stimulation. (A) Image of a capillary that lay 40 μm below the pial surface. (B) Velocity measurements from capillary in A. Upper: Raw line-scan data from a single trial showing increase in speed subsequent to vibrissa stimulation. Lower: Averaged velocity response to vibrissa (purple) and control (gray) stimuli. (C) Evoked increases in speed to single puffs, measured in and around the vibrissa-related area. Center shows histological reconstruction, green shows location of cytochrome-oxidase–rich regions that correspond to cortical columns, or “barrels,” and large surface arterioles and venules are highlighted in red and blue, respectively. The symbols M and A refer to medial and anterior directions, respectively. (D) Upper: Plot of normalized population velocity response to a single air puff, effectively the “impulse response” (63 vessels). Lower: Plot of normalized population velocity responses during 30 s of stimulation (15 vessels).
Fig. 5.
Fig. 5.
Schematic summary of stimulus-induced changes in the cerebral vasculature. Brief stimulation leads only to arteriole distension, whereas a prolonged period of stimulation leads to an initial increase in arterial distension followed by a rise in capillary flow and finally venous distention.

References

    1. Ogawa S, Lee TM, Nayak AS, Glynn P. Oxygenation-sensitive contrast in magnetic resonance image of rodent brain at high magnetic fields. Magn Reson Med. 1990;14:68–78. - PubMed
    1. Grinvald A, Lieke EE, Frostig RD, Gilbert CD, Wiesel TN. Functional architecture of cortex revealed by optical imaging of intrinsic signals. Nature. 1986;324:361–364. - PubMed
    1. Logothetis NK, Wandell BA. Interpreting the BOLD signal. Annu Rev Physiol. 2004;66:735–769. - PubMed
    1. Buxton RB, Wong EC, Frank LR. Dynamics of blood flow and oxygenation changes during brain activation: the balloon model. Magn Reson Med. 1998;39:855–864. - PubMed
    1. Mandeville JB, et al. Evidence of a cerebrovascular postarteriole windkessel with delayed compliance. J Cereb Blood Flow Metab. 1999;19:679–689. - PubMed

Publication types

LinkOut - more resources