. 2011 Jun;121(6):2301-12.
doi: 10.1172/JCI44824. Epub 2011 May 2.

Pivotal role of cardiomyocyte TGF-β signaling in the murine pathological response to sustained pressure overload

Affiliations

Pivotal role of cardiomyocyte TGF-β signaling in the murine pathological response to sustained pressure overload

Norimichi Koitabashi et al. J Clin Invest. 2011 Jun.

Abstract

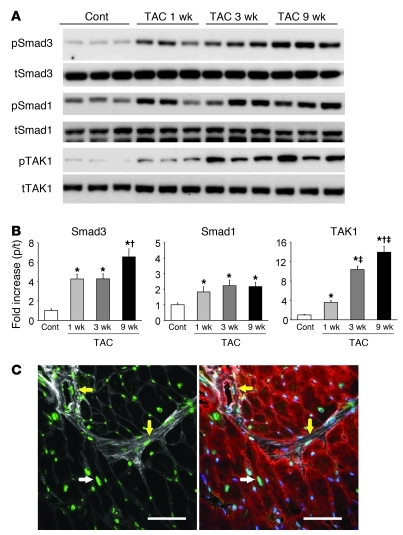
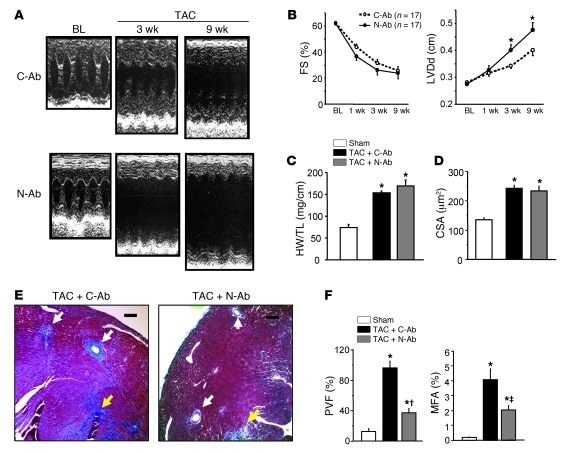
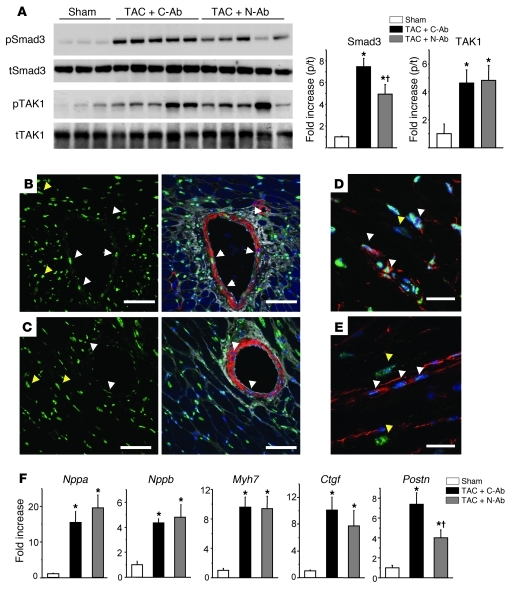
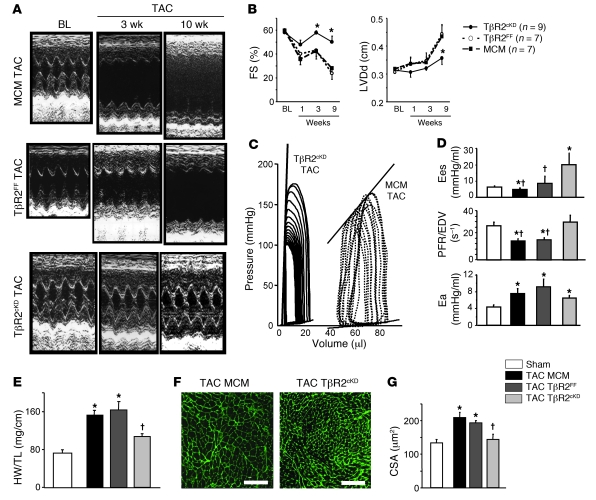
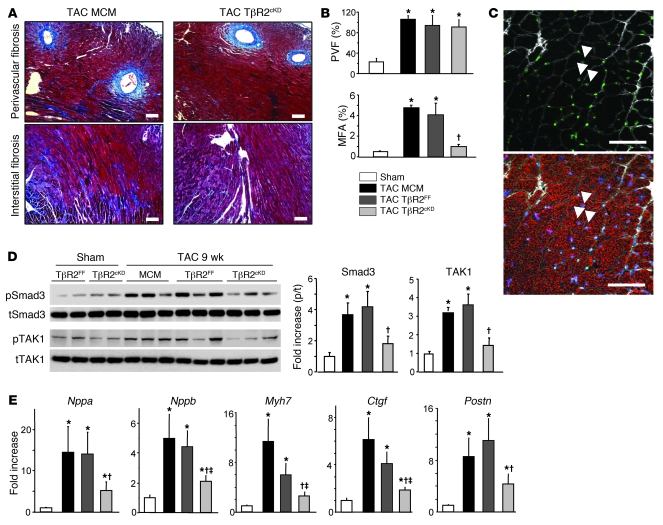
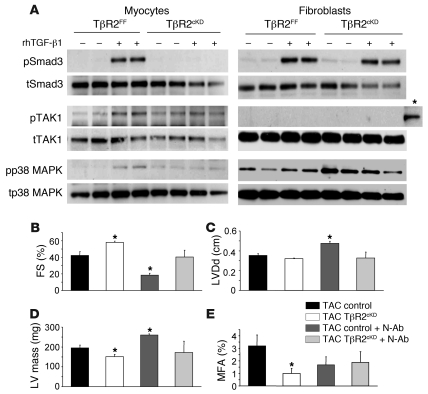
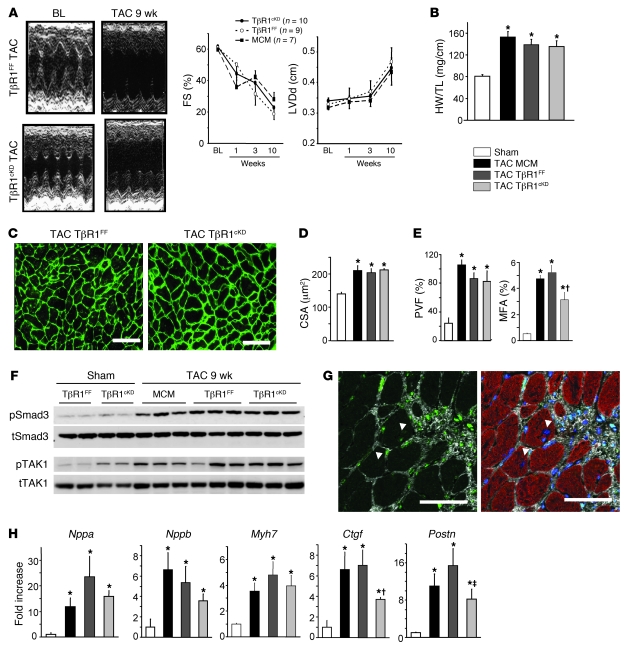
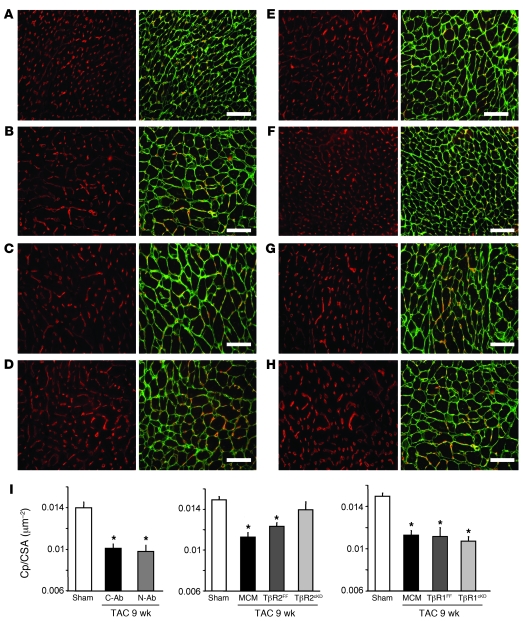
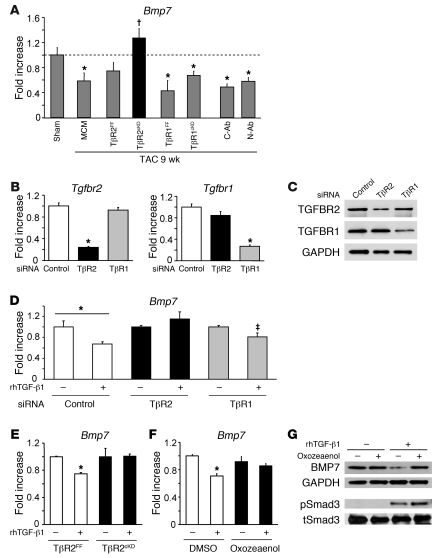
The cardiac pathological response to sustained pressure overload involves myocyte hypertrophy and dysfunction along with interstitial changes such as fibrosis and reduced capillary density. These changes are orchestrated by mechanical forces and factors secreted between cells. One such secreted factor is TGF-β, which is generated by and interacts with multiple cell types. Here we have shown that TGF-β suppression in cardiomyocytes was required to protect against maladaptive remodeling and involved noncanonical (non-Smad-related) signaling. Mouse hearts subjected to pressure overload and treated with a TGF-β-neutralizing Ab had suppressed Smad activation in the interstitium but not in myocytes, and noncanonical (TGF-β-activated kinase 1 [TAK1]) activation remained. Although fibrosis was greatly reduced, chamber dysfunction and dilation persisted. Induced myocyte knockdown of TGF-β type 2 receptor (TβR2) blocked all maladaptive responses, inhibiting myocyte and interstitial Smad and TAK1. Myocyte knockdown of TβR1 suppressed myocyte but not interstitial Smad, nor TAK1, modestly reducing fibrosis without improving chamber function or hypertrophy. Only TβR2 knockdown preserved capillary density after pressure overload, enhancing BMP7, a regulator of the endothelial-mesenchymal transition. BMP7 enhancement also was coupled to TAK1 suppression. Thus, myocyte targeting is required to modulate TGF-β in hearts subjected to pressure overload, with noncanonical pathways predominantly affecting the maladaptive hypertrophy/dysfunction.


Figures

Figure 1
Figure 1. Smad3 and TAK1 phosphorylation are increased in chronic phases of pressure overload.
(A) Representative Western blot for phosphorylated (p-) and total (t-) Smad3, Smad1, and TAK1 using LV tissue lysates after TAC. Cont, sham control. (B) Summary data for immunoblot. n = 4–6. *P < 0.05 vs. sham; P < 0.05 vs. 3-week TAC; P < 0.05 vs. 1-week TAC. (C) Immunostaining for phospho-Smad3 (green) in 9-week TAC LV myocardium. Blue, DAPI (nucleic acid); red, sarcomeric α-actinin (myocytes); white, WGA (membrane/extracellular matrix). White arrows, cardiomyocyte Smad3 activation; yellow arrows, nonmyocyte (e.g., fibroblast, vascular SMC) Smad3 activation. Scale bars: 50 μm.
Figure 2
Figure 2. Effect of TGF-β N-Ab on cardiac response to TAC.
(A and B) Temporal changes of FS and LV diastolic dimension (LVDd). *P < 0.05 vs. C-Ab, ANOVA. BL, baseline. (C) Heart weight/tibia length ratio (HW/TL). n = 10 (sham); 17 (TAC plus C-AB and TAC plus N-Ab). *P < 0.05 vs. sham. (D) Averaged cardiomyocyte cross-sectional area (CSA) obtained by WGA staining, 500–800 cells per heart, 10 hearts per group. *P < 0.05 vs. sham. (E) Representative Masson trichrome staining. White arrows, perivascular fibrosis; yellow arrows, interstitial fibrosis. N-Ab treatment markedly suppressed perivascular fibrosis. Scale bars: 100 μm. (F) Summary results for perivascular fibrosis area (PVF) and myocardial fibrosis area (MFA). n = 8 (sham); 17 (TAC plus C-Ab and TAC plus N-Ab). *P < 0.05 vs. sham; P < 0.001, P < 0.05 vs. TAC plus C-Ab.
Figure 3
Figure 3. N-Ab suppresses Smad activation in noncardiomyocytes.
(A) Western blot for Smad3 and TAK1 phosphorylation in 9-week TAC myocardium with N-Ab or C-Ab. Summary data shows reduced activation of Smad3, but not TAK1. n = 6 per group. *P < 0.01 vs. sham; P < 0.05 vs. TAC plus C-Ab. (BE) Phospho-Smad3 immunostaining (green) in 9-week TAC myocardium treated with C-Ab (B and D) and N-Ab (C and E). Scale bars: 50 μm. (B and C) Smad3 activation in vascular SMCs was suppressed by N-Ab treatment. Red, SMA (SMCs); blue, DAPI; white, WGA. White arrows, SMC Smad3 activation; yellow arrows, cardiomyocyte Smad activation. (D and E) Smad3 activation in cardiac fibroblasts was suppressed by N-Ab. Red, vimentin (cardiac fibroblasts); blue, DAPI. White arrows, fibroblast Smad3 activation; yellow arrows, cardiomyocyte Smad3 activation. (F) mRNA expression, normalized to Gapdh and then to sham data, assessed by real-time RT-PCR. n = 4 (sham); 10 (TAC plus C-Ab and TAC plus N-Ab). *P < 0.01 vs. sham; P < 0.05 vs. TAC plus C-Ab.
Figure 4
Figure 4. TβR2cKD model displays markedly suppressed cardiac hypertrophy and remodeling after TAC.
(A) Representative M-mode echocardiogram after TAC. (B) Temporal changes of FS and LV diastolic dimension. *P < 0.05 vs. MCM and TβR2FF. (C and D) Cardiac function, assessed by PV loops, was improved in TβR2cKD animals. (C) Representative PV loop. (D) Summary data for end-systolic elastance (Ees), as a measure of contractility, peak filling rate/EDV (PFR/EDV), as a measure of diastolic function, and arterial elastance (Ea), as a measure of afterload. n = 4–7 per group. *P < 0.05 vs. sham; P < 0.05 vs. TβR2cKD; 1-way ANOVA, Tukey test. (EG) Cardiac hypertrophy was inhibited in TβR2cKD animals. *P < 0.05 vs. sham (all genotypes); P < 0.05 vs. TAC MCM and TAC TβR2FF. (E) Heart weight/tibia length ratio. n = 8 (sham); 11 (TAC MCM); 6 (TAC TβR2FF); 9 (TAC TβR2cKD). (F) Representative WGA staining for CSA measurement. Scale bars: 100 μm. (G) Myocyte hypertrophy, as assessed by CSA. Averaged data from 400–800 cells per heart. n = 4 (sham); 7 (TAC MCM); 5 (TAC TβR2FF and TAC TβR2cKD).
Figure 5
Figure 5. Interstitial fibrosis, but not perivascular fibrosis, is inhibited in the TβR2cKD model.
(A) Representative Masson trichrome staining in 9-week TAC. Scale bars: 100 μm. (B) Summary results for perivascular fibrosis area and myocardial fibrosis area. n = 7 (sham); 11 (TAC MCM); 6 (TAC TβR2FF); 9 (TAC TβR2cKD). *P < 0.05 vs. sham, P < 0.05 vs. TAC TβR2FF and TAC MCM. (C) Phospho-Smad3 immunostaining (green) in 9-week TAC myocardium of TβR2cKD mouse. White arrowheads, cardiomyocyte Smad3 activation. (D) Representative Western blot for Smad3 and TAK1 after TAC showed suppression with TβR2cKD mice. Summary results are also shown (n = 5 per group). *P < 0.05 vs. sham; P < 0.05 vs. TAC TβR2FF and TAC MCM. (E) mRNA expression, normalized to Gapdh and then to sham data. n = 7 (sham); 4 (TAC MCM); 5 (TAC TβR2FF); 8 (TAC TβR2cKD).*P < 0.05 vs. sham, P < 0.05 vs. TAC TβR2FF, P < 0.05 vs. TAC MCM.
Figure 6
Figure 6. Cardiomyocyte TβR2 knockdown inhibits TGF-β–mediated Smad3 and TAK1 pathways and compensates TGF-β N-Ab–mediated cardiac dysfunction.
(A) Representative Western blots for Smad3, TAK1, and its downstream target, p38 MAPK, using cultured adult mouse cardiomyocytes and cardiac fibroblasts with or without rhTGF-β1 (5 ng/ml, 20 minutes stimulation). TAK1 phosphorylation could not be detected in cultured adult cardiac fibroblasts. A positive control band from wild-type adult mouse heart lysate is also shown (asterisk). (BD) Summarized echo data of 3-week TAC. (B) FS. (C) LV diastolic dimension. (D) Estimated LV mass. n = 4 per group (control group contains 2 MCM and 2 TβR2FF). (E) Myocardial fibrosis area, estimated by Masson trichrome staining. *P < 0.05 vs. control.
Figure 7
Figure 7. Cardiomyocyte TβR1 knockdown does not prevent cardiac hypertrophy and remodeling in response to pressure overload.
(A). Representative M-mode echocardiogram after TAC, and temporal changes of FS and LV diastolic dimension. (BD). Cardiac hypertrophy was not inhibited in TβR1cKD animals. *P < 0.05 vs. sham. (B) Heart weight/tibia length ratio. n = 8 (sham); 11 (TAC MCM); 9 (TAC TβR1FF); 10 (TAC TβR1cKD). (C) Representative WGA staining for CSA measurement. Scale bars: 50 μm. (D) Myocyte hypertrophy, as assessed by CSA. Averaged data from 400–800 cells per heart. n = 4 (sham); 7 (TAC MCM), 5 (TAC TβR1FF and TAC TβR1cKD). (E) Reduced myocardial but not perivascular fibrosis area in TβR1cKD mice. n = 4 (sham); 7 (TAC MCM), 5 (TAC TβR1FF and TAC TβR1cKD). *P < 0.05 vs. sham; P < 0.05 vs. TAC TβR1FF. (F) Representative Western blot for Smad3 and TAK1 activation after TAC. (G) Representative phospho-Smad3 immunostaining in LV after 9-week TAC in TβR1cKD. Green, phospho-Smad3; red, sarcomeric α-actinin; blue, DAPI; white, WGA. White arrowheads, cardiomyocyte Smad3 activation. Scale bars: 50 μm. (H) mRNA expression levels, normalized to Gapdh and then to sham data, assessed by real-time RT-PCR. n = 7 (sham); 4 (TAC MCM); 5 (TAC TβR1FF); 8 (TAC TβR1cKD). *P < 0.05 vs. sham; P < 0.05 vs. TAC TβR1FF; P < 0.05 vs. TAC MCM.
Figure 8
Figure 8. Hearts with suppressed TβR2 have preserved capillary density/myocyte area ratio.
(AH) Myocardium stained for endothelial calls (red, isolectin B4) or WGA (green) in (A) sham, (B) 9-week TAC plus C-Ab, (C) 9-week TAC plus N-Ab, (D) MCM with 9-week TAC, (E) TβR2FF with 9-week TAC, (F) TβR2cKD with 9-week TAC, (G) TβR1FF with 9-week TAC, and (H) TβR1cKD with 9-week TAC hearts. Scale bars: 50 μm. (I) Capillary density (Cp), normalized to myocyte CSA, declined after TAC, and was unaltered in N-Ab–treated and TβR1cKD hearts, but enhanced in TβR2cKD hearts. *P < 0.05 vs. sham.
Figure 9
Figure 9. Suppression of myocyte TβR2 uniquely upregulated BMP7 through TAK1 signaling.
(A) Myocardial gene expression of Bmp7 declined after TAC in all groups except TβR2cKD. *P < 0.05 vs. sham; P < 0.05 vs. MCM and TβR2FF. (B and C) Gene knockdown by TβR2 or TβR1 siRNA transfection in cultured neonatal rat cardiomyocytes. (B) Tgfbr2 and Tgfbr1 mRNA levels, normalized to Gapdh and then to control siRNA, as assessed by real-time RT-PCR. n = 4 per group. *P < 0.05 vs. control. (C) Representative Western blot for TβR2 or TβR1. (D) TGF-β1–mediated downregulation of Bmp7 was more effectively blocked by TβR2 siRNA than by TβR1 siRNA. rhTGF-β1 was administered at 5 ng/ml for 24 hours. *P < 0.05 as indicated; P < 0.05, 2-way ANOVA, for interaction of siRNA and rhTGF-β1 effect. (EG) BMP7 expression in cultured adult mouse cardiomyocytes. TGF-β–mediated Bmp7 mRNA downregulation was blunted in TβR2cKD animals (E) and by pretreatment with the TAK1 inhibitor oxozeaenol (50 nM; F). *P < 0.05 vs. respective rhTGF-β1–unstimulated control. (G) Western blot for BMP7 using cultured adult mouse cardiomyocytes. Oxozeaenol prevented BMP7 decrease at the protein level, independent of Smad3 activation.

References

    1. Levy D, Garrison RJ, Savage DD, Kannel WB, Castelli WP. Prognostic implications of echocardiographically determined left ventricular mass in the Framingham Heart Study. N Engl J Med. 1990;322(22):1561–1566. - PubMed
    1. Frey N, Olson EN. Cardiac hypertrophy: the good, the bad, and the ugly. Annu Rev Physiol. 2003;65:45–79. doi: 10.1146/annurev.physiol.65.092101.142243. - DOI - PubMed
    1. Katz AM. Maladaptive growth in the failing heart: the cardiomyopathy of overload. Cardiovasc Drugs Ther. 2002;16(3):245–249. doi: 10.1023/A:1020604623427. - DOI - PubMed
    1. Mudd JO, Kass DA. Tackling heart failure in the twenty-first century. Nature. 2008;451(7181):919–928. doi: 10.1038/nature06798. - DOI - PubMed
    1. Manabe I, Shindo T, Nagai R. Gene expression in fibroblasts and fibrosis: involvement in cardiac hypertrophy. Circ Res. 2002;91(12):1103–1113. doi: 10.1161/01.RES.0000046452.67724.B8. - DOI - PubMed

Publication types

MeSH terms

Substances