. 2011 Jun;121(6):2210-20.
doi: 10.1172/JCI43586. Epub 2011 May 2.

Epicutaneous challenge of orally immunized mice redirects antigen-specific gut-homing T cells to the skin

Affiliations

Epicutaneous challenge of orally immunized mice redirects antigen-specific gut-homing T cells to the skin

Michiko K Oyoshi et al. J Clin Invest. 2011 Jun.

Abstract

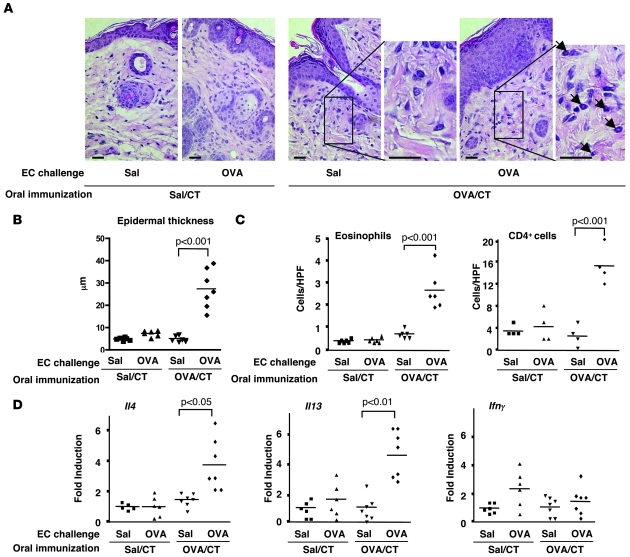
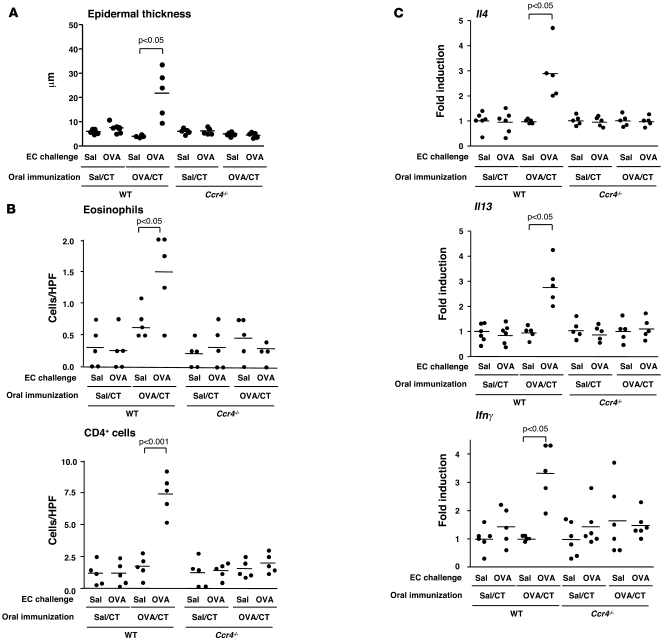
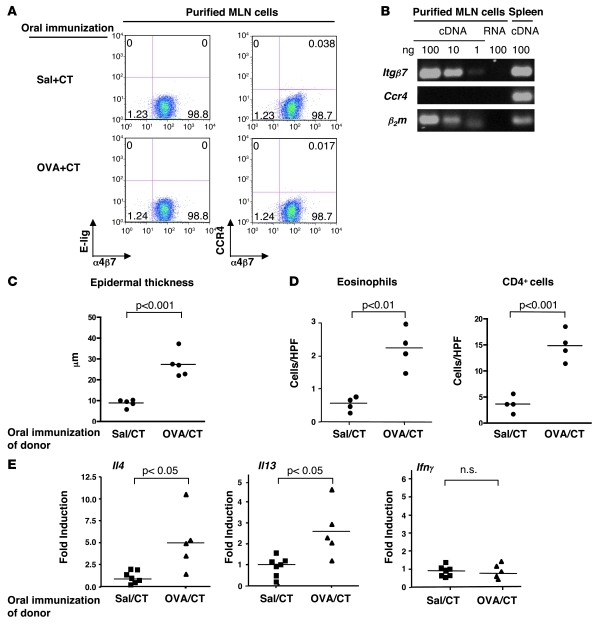
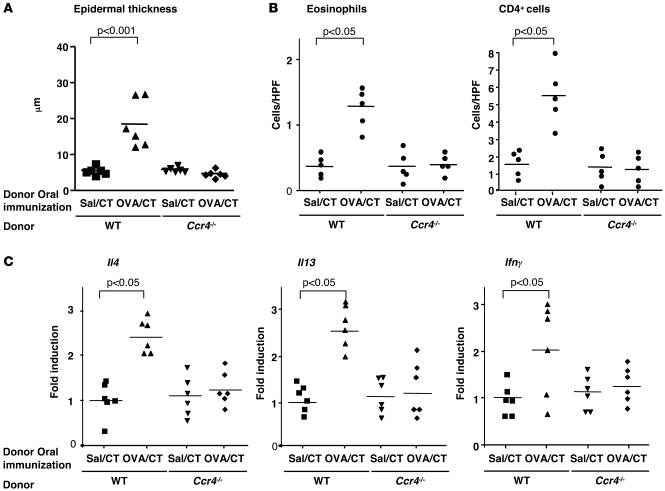
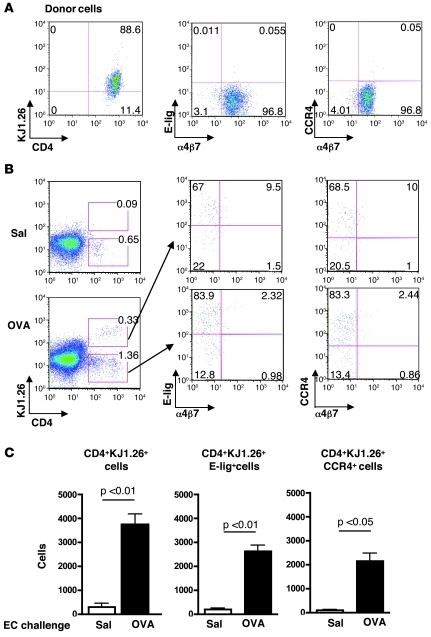
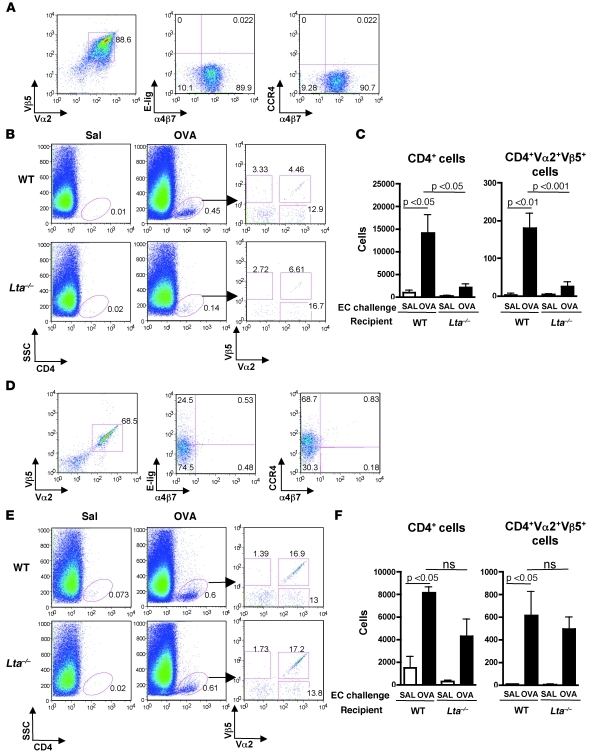
Patients with atopic dermatitis (AD) often suffer from food allergy and develop flares upon skin contact with food allergens. However, it is unclear whether T cells sensitized to allergens in the gut promote this skin inflammation. To address this question, we orally immunized WT mice and mice lacking the skin-homing chemokine receptor Ccr4 (Ccr4-/- mice) with OVA and then challenged them epicutaneously with antigen. Allergic skin inflammation developed in the WT mice but not in the mutants and was characterized by epidermal thickening, dermal infiltration by eosinophils and CD4+ T cells, and upregulation of Th2 cytokines. T cells purified from mesenteric lymph nodes (MLNs) of orally immunized WT mice transferred allergic skin inflammation to naive recipients cutaneously challenged with antigen, but this effect was lost in T cells purified from Ccr4-/- mice. In addition, the ability of adoptively transferred OVA-activated T cells to home to the skin following cutaneous OVA challenge was ablated in mice that lacked lymph nodes. These results indicate that cutaneous exposure to food antigens can reprogram gut-homing effector T cells in LNs to express skin-homing receptors, eliciting skin lesions upon food allergen contact in orally sensitized AD patients.


Figures

Figure 1
Figure 1. Dermal infiltrates and cytokine expression in EC-challenged skin of orally immunized BALB/c mice.
(A) Representative photomicrographs of H&E sections from EC-challenged skin of orally sensitized mice with Sal/CT or OVA/CT. Scale bars: 10 μm. Arrows point to eosinophils. (B) Epidermal thickness. (C) Numbers per HPF of eosinophils and CD4+ cells infiltrating the dermis. (D) Relative cytokine mRNA expression. The mean for saline-challenged skin of saline immunized mice was arbitrarily set at 1. Values represent individual mice, and bars represent mean (n = 6–7 mice per group). Two-tailed Student’s t test was used to determine statistical differences between each set of 2 groups. Similar results were obtained in 2 other independent experiments with 4 mice per group.
Figure 2
Figure 2. Dermal infiltrates and cytokine expression in EC-challenged skin of orally immunized C57BL/6 WT and Ccr4–/– mice.
(A) Epidermal thickness. (B) Numbers per HPF of eosinophils and CD4+ cells infiltrating the dermis. (C) Relative cytokine mRNA expression. The mean for saline-challenged skin of saline-immunized mice was arbitrarily set at 1. Values represent individual mice, and bars represent means (n = 5–6 mice per group). Two-tailed Student’s t test was used to determine statistical differences between each set of 2 groups. Similar results were obtained in another independent experiment with 4 mice per group.
Figure 3
Figure 3. Adoptive transfer of allergic skin inflammation by CD4+α4β7+ T cells from MLNs of orally immunized BALB/c mice with OVA.
(A) FACS analysis of α4β7, E-lig, and CCR4 expression by OVA-stimulated purified CD4+α4β7+ MLN T cells used in adoptive transfer (representative of 3 experiments). Numbers indicate the percentage of cells in each quadrant in purified CD4+α4β7+ cells. (B) RT-PCR analysis of integrin β7 (Itgb7) and Ccr4 expression in adoptively transferred CD4+α4β7+ MLN T cells. Spleen cDNA was used as a positive control. β2 microglobulin (β2m) was used as a housekeeping gene. RNA from purified MLN cells used as a control for contamination by genomic DNA gave no detectable signal. Similar data were obtained in 2 other independent experiments. (C) Epidermal thickness. (D) Numbers per HPF of eosinophils and CD4+ cells infiltrating the dermis in OVA-challenged skin of recipients of CD4+α4β7+ T cells from MLNs of donors orally immunized with saline or OVA. (E) Relative cytokine mRNA expression in OVA-challenged skin. The mean for OVA-challenged skin of recipients of CD4+α4β7+ T cells from MLNs of donors orally immunized with saline was arbitrarily set at 1. Values represent individual mice, and mean bars are shown (n = 4–7 mice per group). Two-tailed Student’s t test was used to determine statistical differences between each set of 2 groups. Similar results were obtained in 2 other independent experiments with 3 mice per group.
Figure 4
Figure 4. Adoptive transfer of allergic skin inflammation by CD4+α4β7+ T cells from MLNs of orally immunized mice with OVA is dependent on CCR4.
(A) Epidermal thickness. (B) Numbers per HPF of eosinophils and CD4+ cells infiltrating the dermis in OVA-challenged skin of recipients of CD4+α4β7+ T cells from MLNs of WT and Ccr4–/– C57BL/6 donors orally immunized with saline or OVA. (C) Relative cytokine mRNA expression in OVA-challenged skin. The mean for OVA-challenged skin of recipients of CD4+α4β7+ T cells from MLNs of WT donors orally immunized with saline was arbitrarily set at 1. Values represent individual mice, and bars represent means. (n = 5–6 mice per group). Two-tailed Student’s t test was used to determine statistical differences between each set of 2 groups. Similar results were obtained in another independent experiment with 4 mice per group.
Figure 5
Figure 5. Adoptively transferred CD4+α4β7+ effector T cells home to antigen-challenged skin sites in BALB/c mice.
(A) Representative FACS analysis of CD4+α4β7+ T cells from MLNs of DO11.10 mice used in adoptive transfer (representative of 3 experiments). Numbers indicate the percentage of cells in each quadrant in purified CD4+α4β7+ T cells. CD4+KJ1.26+ cells express DO11.10 transgenic TCR. (B) Representative FACS analysis of cells isolated from OVA- or saline-challenged ears of recipients of DO11.10 MLN CD4+α4β7+ T cells. Numbers indicate the percentage of CD4+KJ1.26+ and CD4+KJ1.26 cells in total ear cells (left) and the percentage of cells in each quadrant after gating on each CD4+ population (middle and right). (C) Number of donor-derived cells in the skin of recipients of CD4+α4β7+ T cells from MLNs of DO11.10 mice challenged with OVA (n = 4 mice) or saline (n = 3 mice). Data represent the mean and SEM. Two-tailed Student’s t test was used to determine statistical differences between each set of 2 groups. Similar results were obtained in 2 other independent experiments with 3 mice per group.
Figure 6
Figure 6. Adoptively transferred CD4+α4β7+ effector T cells fail to home to antigen-challenged skin sites of Lta–/– mice.
(A) FACS analysis of CD4+α4β7+ T cells from MLNs of OT-II mice used in adoptive transfer (representative of 3 experiments). (B) Representative FACS analysis of cells isolated from saline-challenged ears (n = 6 mice) and OVA-challenged ears (n = 7 mice) of recipients of MLN cells. Ears from each mouse were pooled. (C) Number of CD4+ cells and donor-derived CD4+Vα2+Vβ5+ cells in the challenged ears of recipients of MLN cells. n = 6 and 7 mice, respectively, in saline-challenged versus OVA-challenged groups. (D) Representative FACS analysis of CD4+ T cells from PLNs of OT-II mice used in adoptive transfer (representative of 3 experiments). (E) Representative FACS analysis of cells isolated from saline-challenged ears and OVA-challenged ears of recipients of PLN cells. Ears from each mouse were pooled. (F) Number of CD4+ cells and of donor-derived CD4+Vα2+Vβ5+ cells in the challenged ears of recipients of PLN cells. n = 3 and 4 mice, respectively, in saline-challenged versus OVA-challenged groups. Numbers in A and D indicate the percentage of Vα2+Vβ5+ OT-II transgenic TCR-expressing cells (left) and the percentage of cells in each quadrant (middle and right) in purified CD4+α4β7+ T cells. Numbers in B and E indicate the percentage of CD4+ cells in total ear cells (left and middle) and the percentage of Vα2+, Vβ5+, and Vα2+Vβ5+ cells after gating on CD4+ cells (right). Data in C and F represent the mean and SEM. One-way ANOVA was used to determine statistical differences between groups. For each of the MLN and PLN cell transfer experiments, similar results were obtained in another independent experiment with 3 mice per group.

References

    1. Sicherer SH, Sampson HA. Food hypersensitivity and atopic dermatitis: pathophysiology, epidemiology, diagnosis, and management. J Allergy Clin Immunol. 1999;104(3 pt 2):S114–S122. doi: 10.1016/S0091-6749(99)70053-9. - DOI - PubMed
    1. Sampson HA. Role of immediate food hypersensitivity in the pathogenesis of atopic dermatitis. J Allergy Clin Immunol. 1983;71(5):473–480. doi: 10.1016/0091-6749(83)90464-5. - DOI - PubMed
    1. Abernathy-Carver KJ, Sampson HA, Picker LJ, Leung DY. Milk-induced eczema is associated with the expansion of T cells expressing cutaneous lymphocyte antigen. J Clin Invest. 1995;95(2):913–918. doi: 10.1172/JCI117743. - DOI - PMC - PubMed
    1. Niggemann B. Role of oral food challenges in the diagnostic work-up of food allergy in atopic eczema dermatitis syndrome. Allergy. 2004;59(suppl 78):32–34. - PubMed
    1. Darsow U, et al. The prevalence of positive reactions in the atopy patch test with aeroallergens and food allergens in subjects with atopic eczema: a European multicenter study. Allergy. 2004;59(12):1318–1325. doi: 10.1111/j.1398-9995.2004.00556.x. - DOI - PubMed

Publication types

MeSH terms