Comparative Study
. 2011 May 3:11:111.
doi: 10.1186/1471-2334-11-111.

Fever screening during the influenza (H1N1-2009) pandemic at Narita International Airport, Japan

Affiliations
Comparative Study

Fever screening during the influenza (H1N1-2009) pandemic at Narita International Airport, Japan

Hiroshi Nishiura et al. BMC Infect Dis. .

Abstract

Background: Entry screening tends to start with a search for febrile international passengers, and infrared thermoscanners have been employed for fever screening in Japan. We aimed to retrospectively assess the feasibility of detecting influenza cases based on fever screening as a sole measure.

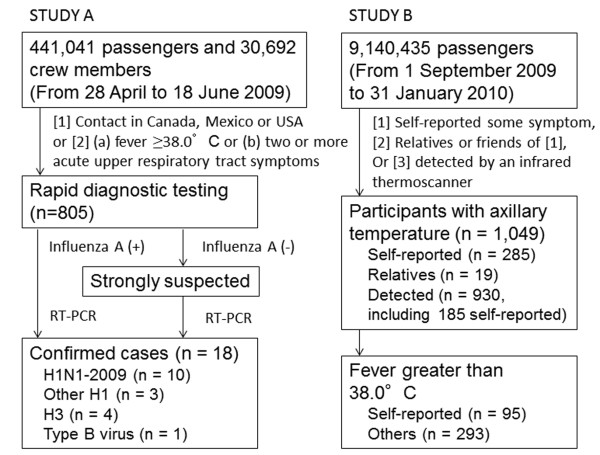
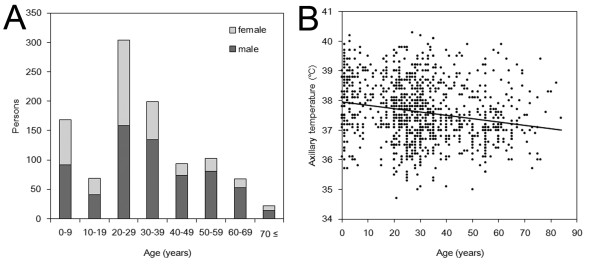
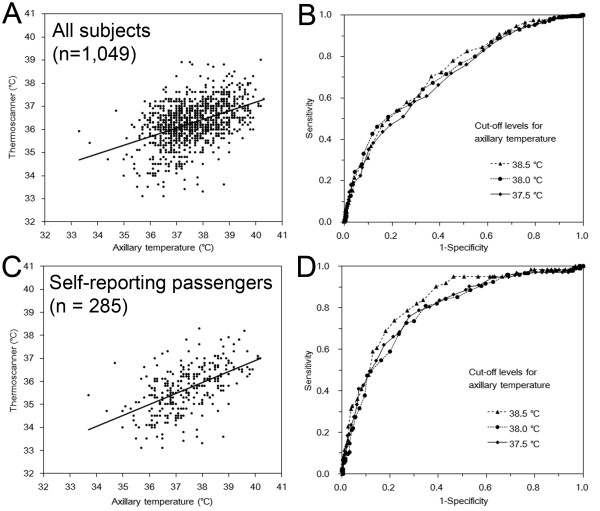
Methods: Two datasets were collected at Narita International Airport during the 2009 pandemic. The first contained confirmed influenza cases (n = 16) whose diagnosis took place at the airport during the early stages of the pandemic, and the second contained a selected and suspected fraction of passengers (self-reported or detected by an infrared thermoscanner; n = 1,049) screened from September 2009 to January 2010. The sensitivity of fever (38.0 °C) for detecting H1N1-2009 was estimated, and the diagnostic performances of the infrared thermoscanners in detecting hyperthermia at cut-off levels of 37.5 °C, 38.0 °C and 38.5 °C were also estimated.

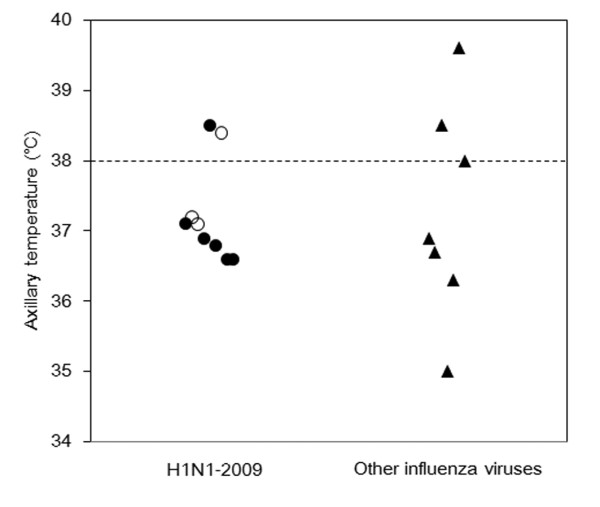
Results: The sensitivity of fever for detecting H1N1-2009 cases upon arrival was estimated to be 22.2% (95% confidence interval: 0, 55.6) among nine confirmed H1N1-2009 cases, and 55.6% of the H1N1-2009 cases were under antipyretic medications upon arrival. The sensitivity and specificity of the infrared thermoscanners in detecting hyperthermia ranged from 50.8-70.4% and 63.6-81.7%, respectively. The positive predictive value appeared to be as low as 37.3-68.0%.

Conclusions: The sensitivity of entry screening is a product of the sensitivity of fever for detecting influenza cases and the sensitivity of the infrared thermoscanners in detecting fever. Given the additional presence of confounding factors and unrestricted medications among passengers, reliance on fever alone is unlikely to be feasible as an entry screening measure.


Figures

Figure 1
Figure 1
Flow chart of participants in the study. Two datasets were collected at Narita International Airport. The first contained confirmed influenza cases whose diagnosis took place at the airport during the early stages of the pandemic (Study A). The second contained a selected and suspected fraction of passengers (self-reported or detected by an infrared thermoscanner) screened from September 2009 to January 2010 (Study B).
Figure 2
Figure 2
Simplified map of Narita International Airport. The airport has two discrete terminals. A total of four infrared thermoscanners were placed in each terminal. Terminal 2 is mostly used by alliance A, while Terminal 1 is roughly divided into two groups of satellites used by alliances B and C, respectively. The stationary infrared thermoscanners were set up near the quarantine station before immigration.
Figure 3
Figure 3
Distribution of the axillary temperatures among the confirmed influenza cases. The axillary temperatures upon arrival were compared between the cases with H1N1-2009 (n = 9) and the cases with other influenza viruses (n = 7). The confirmed cases represent patients whose diagnosis took place at Narita International Airport from 28 April to 18 June 2009. Unfilled symbols represent passengers without medications upon arrival and filled symbols represent passengers with medications. The horizontal dashed line is the reference line of 38.0°C, above which cases may be regarded as having hyperthermia.
Figure 4
Figure 4
Age distribution and correlation of age with axillary temperature among the screened passengers (n = 1,049). (A) Age distribution of the screened passengers from 1 September 2009 to 31 January 2010. The screened passengers represent those who fulfilled one of the following selection criteria: (a) those who self-reported some symptom or actively visited the health consultation room of the quarantine station; (b) relatives or friends of self-reporting individuals; or (c) those who were detected by an infrared thermoscanner (based on a predefined threshold reading of 35.4°C). (B) Scatter plot of the axillary temperatures as a function of the age of the screened passengers. The straight line is a fitted line by means of a least squares regression (prediction = 37.9-0.011x, where x is the passenger age). The adjusted coefficient of determination, R2, is 0.038.
Figure 5
Figure 5
Relationship between the axillary temperature and the surface temperature measured by an infrared thermoscanner. (A, C) Scatter plots examining the correlations between the surface temperature measured by an infrared thermoscanner and the axillary temperature. The straight line represents a fitted line by means of a least squares regression. The adjusted coefficients of determination, R2, were estimated to be 0.196 and 0.296 for the data shown in (A) and (C), respectively. (B, D) Comparison of the receiver operating characteristic curves showing the relationships between sensitivity (true positives) and 1-specificity (true negatives) in determining the diagnostic performances of the infrared thermoscanners for predicting three different thresholds of hyperthermia definitions (37.5°C, 38.0°C and 38.5°C) based on the axillary temperature. Panels A and B show the data for all the screened passengers (n = 1,049), while panels C and D show the data for the self-reporting passengers only (n = 285).

References

    1. Bell DM. World Health Organization Working Group on International and Community Transmission of SARS. Public health interventions and SARS spread, 2003. Emerg Infect Dis. 2004;10:1900–6. - PMC - PubMed
    1. St John RK, King A, de Jong D, Bodie-Collins M, Squires SG, Tam TW. Border screening for SARS. Emerg Infect Dis. 2005;11:6–10. - PMC - PubMed
    1. Bell DM. World Health Organization Writing Group. Non-pharmaceutical interventions for pandemic influenza, international measures. Emerg Infect Dis. 2006;12:81–7. - PMC - PubMed
    1. McLeod MA, Baker M, Wilson N, Kelly H, Kiedrzynski T, Kool JL. Protective effect of maritime quarantine in South Pacific jurisdictions, 1918-19 influenza pandemic. Emerg Infect Dis. 2008;14:468–70. doi: 10.3201/eid1403.070927. - DOI - PMC - PubMed
    1. Pitman RJ, Cooper BS, Trotter CL, Gay NJ, Edmunds WJ. Entry screening for severe acute respiratory syndrome (SARS) or influenza: policy evaluation. BMJ. 2005;331:1242–3. - PMC - PubMed

Publication types

MeSH terms