. 2011 Jun 24;286(25):22456-68.
doi: 10.1074/jbc.M111.236190. Epub 2011 May 3.

Differential regulation of the postsynaptic clustering of γ-aminobutyric acid type A (GABAA) receptors by collybistin isoforms

Affiliations

Differential regulation of the postsynaptic clustering of γ-aminobutyric acid type A (GABAA) receptors by collybistin isoforms

Tzu-Ting Chiou et al. J Biol Chem. .

Abstract

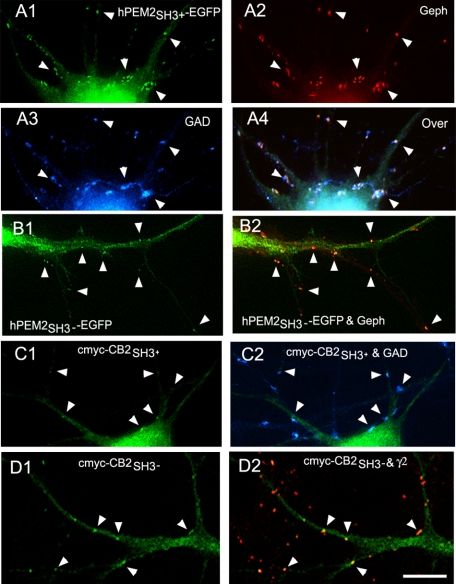
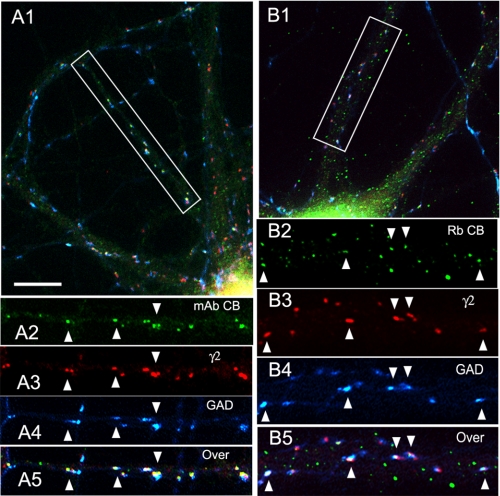
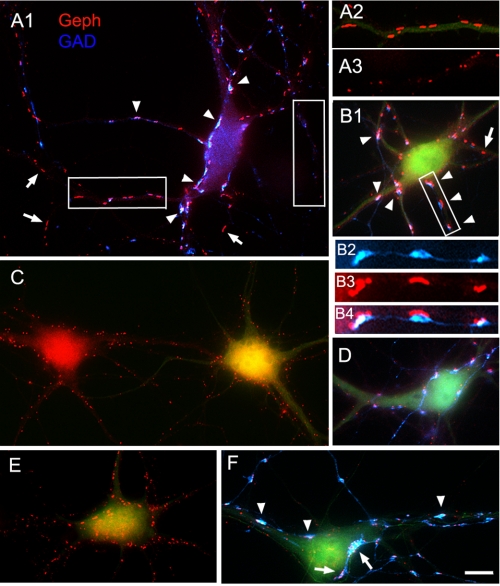
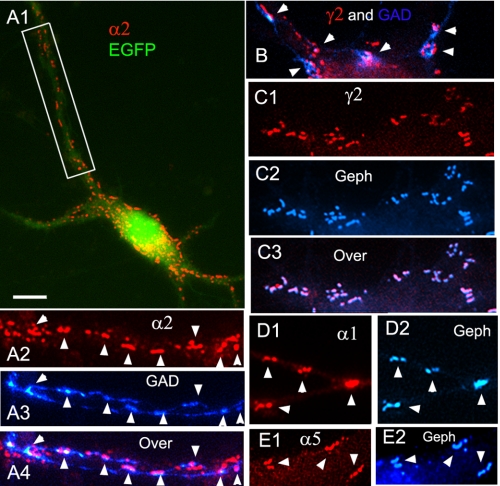
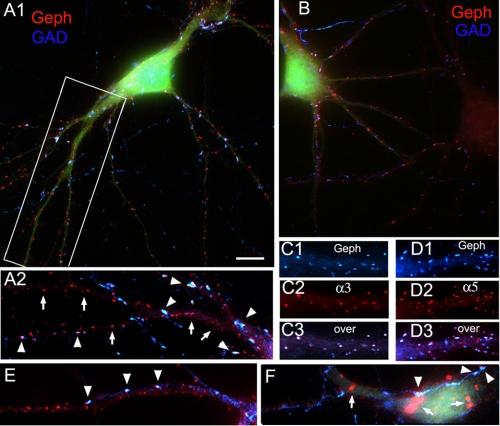
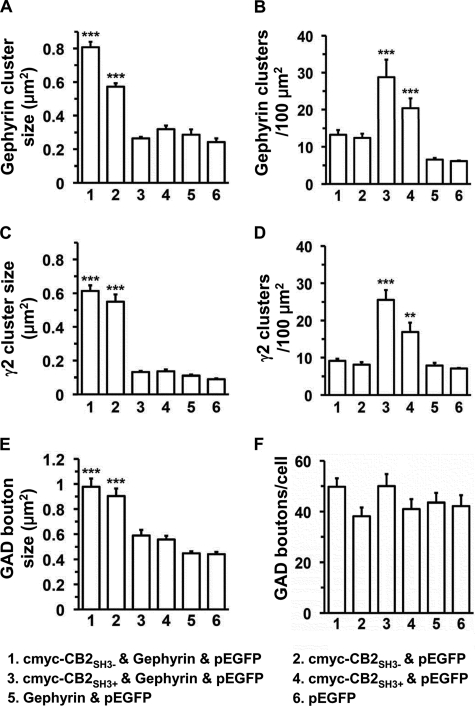
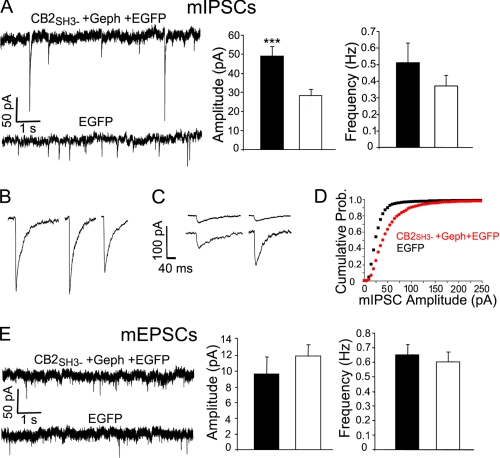
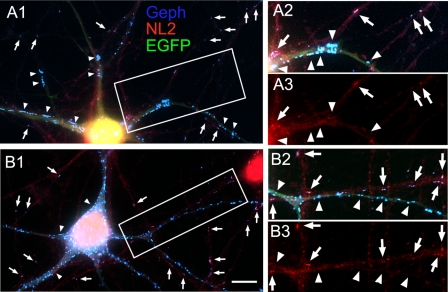
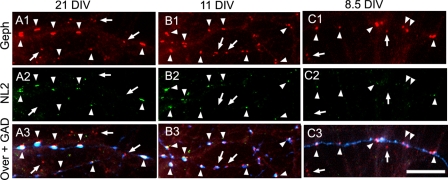
Collybistin promotes submembrane clustering of gephyrin and is essential for the postsynaptic localization of gephyrin and γ-aminobutyric acid type A (GABA(A)) receptors at GABAergic synapses in hippocampus and amygdala. Four collybistin isoforms are expressed in brain neurons; CB2 and CB3 differ in the C terminus and occur with and without the Src homology 3 (SH3) domain. We have found that in transfected hippocampal neurons, all collybistin isoforms (CB2(SH3+), CB2(SH3-), CB3(SH3+), and CB3(SH3-)) target to and concentrate at GABAergic postsynapses. Moreover, in non-transfected neurons, collybistin concentrates at GABAergic synapses. Hippocampal neurons co-transfected with CB2(SH3-) and gephyrin developed very large postsynaptic gephyrin and GABA(A) receptor clusters (superclusters). This effect was accompanied by a significant increase in the amplitude of miniature inhibitory postsynaptic currents. Co-transfection with CB2(SH3+) and gephyrin induced the formation of many (supernumerary) non-synaptic clusters. Transfection with gephyrin alone did not affect cluster number or size, but gephyrin potentiated the clustering effect of CB2(SH3-) or CB2(SH3+). Co-transfection with CB2(SH3-) or CB2(SH3+) and gephyrin did not affect the density of presynaptic GABAergic terminals contacting the transfected cells, indicating that collybistin is not synaptogenic. Nevertheless, the synaptic superclusters induced by CB2(SH3-) and gephyrin were accompanied by enlarged presynaptic GABAergic terminals. The enhanced clustering of gephyrin and GABA(A) receptors induced by collybistin isoforms was not accompanied by enhanced clustering of neuroligin 2. Moreover, during the development of GABAergic synapses, the clustering of gephyrin and GABA(A) receptors preceded the clustering of neuroligin 2. We propose a model in which the SH3- isoforms play a major role in the postsynaptic accumulation of GABA(A) receptors and in GABAergic synaptic strength.


Figures

FIGURE 1.
FIGURE 1.
The various tagged collybistin isoforms target to the GABAergic postsynaptic complex. A1–A4, immunofluorescence of an HP neuron transfected with hPEM2SH3+-EGFP has accumulation of EGFP fluorescence (green) co-localizing with gephyrin clusters (red) in apposition to GAD+ presynaptic terminals (blue). The overlay of the three fluorescence channels is shown in A4. The arrowheads indicate the presence of hPEM2SH3+-EGFP at GABAergic synapses. B1 and B2, a dendrite of a neuron transfected with hPEM2SH3−-EGFP has accumulation of EGFP fluorescence (green) co-localizing with gephyrin clusters (red), as shown by arrowheads. C1 and C2, the soma and dendrites of a neuron transfected with cMyc-CB2SH3+ shows accumulation (arrowheads) of cMyc immunofluorescence (green) apposed to GAD+ presynaptic terminals (blue). D1 and D2, the dendrites of an HP neuron transfected with cMyc-CB2SH3− show cMyc-CB2SH3− clusters (green) that co-localize (arrowheads) with GABAAR γ2 clusters (red). The primary antibodies used were Ms mAb to gephyrin in A2 and B2, sheep anti-GAD in A3 and C2, Ms mAb to cMyc in C1 and D1, and Rb anti-γ2 in D2. Color overlays are shown in A4, B2, C2, and D2. Scale bar, 10 μm for all panels.
FIGURE 2.
FIGURE 2.
In non-transfected hippocampal cultures, endogenous collybistin concentrates at GABAergic synapses. A1–A5, triple label immunofluorescence of 21-DIV cultured HP neurons with mouse mAb to CB (green), Rb anti-γ2 (red), and sheep anti-GAD (blue). Overlays are shown in A1 and A5. The arrowheads show the presence of endogenous CB immunofluorescence at GABAergic synapses. A2–A5 correspond to the boxed area in A1. B1–B5, triple label immunofluorescence of 21-DIV cultured HP neurons with Rb anti-CB (green), guinea pig anti-γ2 (red) and sheep anti-GAD (blue). Overlays are shown in B1 and B5. The arrowheads indicate the presence of endogenous CB immunofluorescence at GABAergic synapses. B2–B5 correspond to the boxed area in B1. Scale bar, 10 μm in A1 and B1, 9 μm in A2–A5, and 5.6 μm in B2–B5.
FIGURE 3.
FIGURE 3.
Neurons co-transfected with cMyc-CB2SH3− and gephyrin develop gephyrin superclusters, frequently at GABAergic synapses. A1–A3 and B1–B4, immunofluorescence of two HP neurons co-transfected with cMyc-CB2SH3−, gephyrin (Geph), and EGFP shows gephyrin superclusters (red) frequently apposed (arrowheads) to GAD+ presynaptic terminals (blue). Transfected cells show EGFP fluorescence (green in A2 and B1 but not shown in A1 for better display of the overlay of the blue and red fluorescence channels). Compare the gephyrin cluster size in a dendrite of a transfected cell (with EGFP green fluorescence) in A2 with that of a dendrite of a non-transfected cell (A3). Note the frequent apposition of GAD+ terminals to the gephyrin superclusters (A1, arrowheads, and B2–B4). The arrows in A1 and B1 show some superclusters with no associated presynaptic GAD+ terminal. Overlays are shown in A1, A2, B1, and B4. A2 and A3 correspond to boxed areas in A1. B2–B4 correspond to the boxed area in B1. C, an HP neuron co-transfected with gephyrin and EGFP (no cMyc-CB3SH3−) shows (cell on the right with EGFP fluorescence) that the size and density of gephyrin clusters (red) are not significantly different from those of a sister non-transfected neuron (neuron on the left). D, a neuron transfected with cMyc-CB2SH3− and EGFP (no gephyrin) has larger gephyrin clusters (red) than the non-transfected neurons or neurons transfected only with gephyrin (compare gephyrin cluster size in D versus C) but not as large as that of neurons co-transfected with cMyc-CB3SH3− and gephyrin (compare D with A1 and B1). GAD immunofluorescence is shown in blue. E and F, two neurons transfected with cMyc-CB3SH3−, gephyrin, and EGFP show gephyrin superclusters (red). The superclusters are frequently apposed (arrows and arrowheads) to GAD+ presynaptic terminals (F). The neuron in F has very large GAD+ terminals, and sometimes they are apposed to a group of smaller gephyrin clusters instead of a supercluster (arrows). A1, B1, and C–F are shown at the same magnification for cluster size comparison between neurons transfected with the various plasmid combinations. The antibodies used were Ms mAb to gephyrin and sheep anti-GAD. Scale bar, 10 μm in A1, B1, and C-F; 6.7 μm in A2–A3; and 4 μm in B2–B4.
FIGURE 4.
FIGURE 4.
Neurons co-transfected with cMyc-CB2SH3− and gephyrin develop GABAAR superclusters. A1–A4, immunofluorescence of a HP neuron co-transfected with cMyc-CB2SH3−, gephyrin (Geph), and EGFP shows GABAAR α2 superclusters (red) frequently apposed (arrowheads) to GAD+ presynaptic terminals (blue). A2–A4 correspond to the boxed areas in A1. B, a transfected neuron shows GABAAR γ2 superclusters (red) apposed to blue GAD+ terminals (arrowheads). C1–C3, transfected neurons show GABAAR γ2 superclusters (red) co-localizing with the gephyrin superclusters (blue) as shown in the overlay (C3). D1 and D2, dendrites of transfected neurons have GABAAR α1 superclusters (red) co-localizing (arrowheads) with gephyrin superclusters (blue). E1 and E2, dendrites of transfected cells show GABAAR α5 superclusters (red) co-localizing (arrowheads) with gephyrin superclusters (blue). Overlays of the red and blue fluorescence are shown in A4, B, and C3. The EGFP fluorescence channel is not shown in the majority of the overlays to better appreciate the co-localization between the red and blue signals. Scale bar, 10 μm in A1 and 4.3 μm in the other panels.
FIGURE 5.
FIGURE 5.
Neurons co-transfected with cMyc-CB2SH3+ and gephyrin develop supernumerary gephyrin and GABAAR clusters, many non-synaptically localized. A1 and A2, immunofluorescence of an HP neuron co-transfected with cMyc-CB2SH3+, gephyrin (Geph), and EGFP shows many gephyrin clusters (red). Some are apposed (arrowheads) to GAD+ presynaptic terminals (blue), but many others (arrows) are not. Transfected cells show EGFP fluorescence (green). A1, overlay of the three fluorescence channels; A2, overlay of red and blue fluorescence. A2 corresponds to the boxed area in A1. B, an HP neuron transfected (neuron on the left) with cMyc-CB2SH3+ and EGFP (no gephyrin) shows more gephyrin clusters than a non-transfected neuron (neuron on the right). C1–C3, in the cMyc-CB2SH3+-, gephyrin-, and EGFP-co-transfected neurons, the majority of gephyrin clusters (C1, blue) co-localized with GABAAR α3 clusters (C2, red), as shown in the overlay (C3). D1–D3, in the cMyc-CB2SH3+-, gephyrin-, and EGFP-co-transfected neurons, many gephyrin clusters (D1, blue) co-localized with GABAAR α5 clusters (D2, red) as shown in the overlay (D3). E and F, a dendrite (E) and the soma (F) of two neurons transfected with cMyc-CB3SH3+, gephyrin, and EGFP. Transfected neurons normally show supernumerary gephyrin clusters (E), some apposed (arrowheads) to GAD+ terminals (blue). Some neurons (F) show large gephyrin (red) aggregates in the cytoplasm (arrows). These neurons had fewer gephyrin clusters at dendrites, but they still had GAD+ contacts (F, arrowheads). In A2, C1–C3, D1–D3, and E, the EGFP fluorescence channel is not shown to better appreciate the co-localization between the red and blue signals. The antibodies used were Ms mAb to gephyrin, sheep anti-GAD, Rb anti-α3, and Rb anti-α5. Scale bar, 10 μm in A1 and B and 6.4 μm in A2, C1–C3, D1–D3, E, and F.
FIGURE 6.
FIGURE 6.
Quantification of the effects on gephyrin and GABAAR clustering and on GABAergic innervation after transfection of HP neurons with cMyc-CB2SH3−, cMyc-CB2SH3+, and gephyrin. A, gephyrin cluster size (1, 0.81 ± 0.03 μm2; 2, 0.57 ± 0.02 μm2; 3, 0.26 ± 0.01 μm2; 4, 0.31 ± 0.02 μm2; 5, 0.28 ± 0.03 μm2; 6, 0.24 ± 0.02 μm2). B, gephyrin cluster density (1, 13.3 ± 1.2 clusters/μm2; 2, 12.4 ± 1.1 clusters/μm2; 3, 28.8 ± 4.7 clusters/μm2; 4, 20.4 ± 2.7 clusters/μm2; 5, 6.5 ± 0.5 clusters/μm2; 6, 6.1 ± 0.1 clusters/100 μm2). C, GABAAR γ2 cluster size (1, 0.61 ± 0.03; 2, 0.55 ± 0.04 μm2; 3, 0.13 ± 0.01 μm2; 4, 0.14 ± 0.01 μm2; 5, 0.11 ± 0.01 μm2; 6, 0.09 ± 0.01 μm2). D, GABAAR γ2 cluster density (1, 9.1 ± 0.6 clusters/100 μm2; 2, 8.1 ± 0.7 clusters/100 μm2; 3, 25.6 ± 2.7 clusters/100 μm2; 4, 16.9 ± 2.5 clusters/100 μm2; 5, 7.9 ± 0.7 clusters/100 μm2; 6, 7.1 ± 0.1 clusters/100 μm2). E, GAD+ presynaptic terminal size (1, 0.98 ± 0.06 μm2; 2, 0.90 ± 0.06 μm2; 3, 0.59 ± 0.04 μm2; 4, 0.56 ± 0.03 μm2; 5, 0.45 ± 0.02 μm2; 6, 0.44 ± 0.02 μm2). F, GAD+ presynaptic terminal density (1, 49.7 ± 3.3 GAD+ puncta/neuron; 2, 38.2 ± 3.5 GAD+ puncta/neuron; 3, 47.2 ± 5.4 GAD+ puncta/neuron; 4, 41.0 ± 3.8 GAD+ puncta/neuron; 5, 43.7 ± 3.4 GAD+ puncta/neuron; 6, 42.8 ± 3.9 GAD+ puncta/neuron). Values are given as mean ± S.E. (error bars). The data were analyzed by one-way analysis of variance with a Tukey-Kramer multiple comparisons test. Numbers 1–6 correspond to different plasmid combinations. ***, p < 0.001; **, p < 0.01 compared with number 6 (EGFP).
FIGURE 7.
FIGURE 7.
Neurons co-transfected with cMyc-CB2SH3− and gephyrin show a significant increase in the amplitude of mIPSCs. A, representative recordings of mIPSCs from HP neurons. The mean amplitude ± S.E. (error bars) of the neurons transfected with cMyc-CB2SH3−, gephyrin (Geph), and EGFP (49.5 ± 5 pA, n = 14 neurons) was significantly larger (p = 0.002) in two-tailed unpaired t test) than that of the neurons transfected with EGFP (28 ± 3 pA, n = 15 neurons). There was no significant difference in the frequency (0.51 ± 0.12 versus 0.37 ± 0.06 Hz, p = 0.30). B, some examples of mIPSCs in neurons transfected with cMyc-CB2SH3−, gephyrin, and EGFP. These neurons frequently showed mIPSCs of very large amplitude. C, some examples of mIPSCs in neurons transfected with EGFP. These neurons seldom showed mIPSCs of large amplitude. D, cumulative probability plots of the mIPSC amplitude of the neurons transfected with cMyc-CB2SH3−, gephyrin, and EGFP (red plot) compared with that of the neurons transfected with EGFP (black plot). The two distributions are different (p < 0.001, Kolmogorov-Smirnov test). E, neurons transfected with cMyc-CB2SH3−, gephyrin, and EGFP showed no significant difference in mEPSC amplitude (10 ± 2 versus 12 ± 2 pA, p = 0.36) or frequency (0.65 ± 0.07 versus 0.60 ± 0.06, p = 0.57) compared with that of neurons transfected with EGFP. Recordings were done in a voltage clamp at −60 mV in the presence of 1 mm MgCl2. The mIPSCs were recorded in the presence of 0.5 μm tetrodotoxin, 5 μm NBQX, and 1 μm strychnine. The mIPSCs were blocked by 25 μm bicuculline. The mEPSCs recordings were done in the presence of 0.5 μm tetrodotoxin and 20 μm bicuculline. The mEPSCs were blocked by 5 μm NBQX. ***, p ≤ 0.002.
FIGURE 8.
FIGURE 8.
The enhanced clustering of gephyrin and GABAARs induced by co-transfection of HP neurons with cMyc-CB2SH3− or cMyc-CB2SH3+ and gephyrin is not accompanied by enhanced clustering of NL2. Triple label immunofluorescence is shown. A1–A3, an HP neuron co-transfected with cMyc-CB2SH3−, gephyrin (Geph), and EGFP (green) has gephyrin superclusters (blue) but no co-localizing NL2 superclusters (red), as indicated by the arrowheads. However, regular synaptic gephyrin clusters that are present in dendrites of non-transfected neurons (arrows) show co-localizing NL2 clusters. A2 and A3 correspond to the boxed area in A1. A1 and A2 show the overlay of the three fluorescence channels. B1–B3, the supernumerary gephyrin clusters (blue) in a neuron co-transfected with cMyc-CB2SH3+, gephyrin, and EGFP (green) show no co-localizing NL2 clusters, as indicated by arrowheads. However, regular synaptic gephyrin clusters in dendrites of non-transfected neurons (arrows) show co-localizing NL2 clusters. The green fluorescence allows the identification of the dendrites of transfected cells. B2 and B3 correspond to the boxed area in B1. B1 and B2 show the overlay of the three fluorescence channels. Scale bar, 10 μm in A1 and B1 and 7.3 μm in A2, A3, B2, and B3.
FIGURE 9.
FIGURE 9.
During the development of HP cultures, the postsynaptic accumulation of NL2 is delayed with respect to the postsynaptic accumulation of gephyrin and GABAARs. Triple label immunofluorescence is shown. A1–A3, mature HP cultures (21 DIV). B1–B3, 11 DIV HP cultures. In 21- and 11-DIV cultures, NL2 (green) forms robust clusters at the majority of GABAergic synapses (arrowheads), co-localizing with gephyrin (Geph) clusters (red) in apposition to GAD+ terminals (blue). However, non-synaptic gephyrin clusters and some synaptic gephyrin clusters show no apparent NL2 co-clustering (arrows). C1–C3, at 8.5 DIV, gephyrin forms robust clusters (red) at GABAergic synapses (arrowheads) in apposition to GAD+ terminals (blue). However, the majority of synaptic NL2 clusters (green) at these synapses (arrowheads) are small and of low fluorescence intensity. Non-synaptic gephyrin clusters have no apparent NL2 (arrows). Scale bar, 10 μm.

References

    1. Kins S., Betz H., Kirsch J. (2000) Nat. Neurosci. 3, 22–29 - PubMed
    1. Rees M. I., Harvey K., Ward H., White J. H., Evans L., Duguid I. C., Hsu C. C., Coleman S. L., Miller J., Baer K., Waldvogel H. J., Gibbon F., Smart T. G., Owen M. J., Harvey R. J., Snell R. G. (2003) J. Biol. Chem. 278, 24688–24696 - PubMed
    1. Harvey K., Duguid I. C., Alldred M. J., Beatty S. E., Ward H., Keep N. H., Lingenfelter S. E., Pearce B. R., Lundgren J., Owen M. J., Smart T. G., Lüscher B., Rees M. I., Harvey R. J. (2004) J. Neurosci. 24, 5816–5826 - PMC - PubMed
    1. Fritschy J. M., Harvey R. J., Schwarz G. (2008) Trends Neurosci. 31, 257–264 - PubMed
    1. Reid T., Bathoorn A., Ahmadian M. R., Collard J. G. (1999) J. Biol. Chem. 274, 33587–33593 - PubMed

Publication types

MeSH terms

LinkOut - more resources