. 2011 Jun 24;286(25):22323-30.
doi: 10.1074/jbc.M110.205229. Epub 2011 May 3.

Inhibition of alanine aminotransferase in silico and in vivo promotes mitochondrial metabolism to impair malignant growth

Affiliations

Inhibition of alanine aminotransferase in silico and in vivo promotes mitochondrial metabolism to impair malignant growth

Gregor Beuster et al. J Biol Chem. .

Abstract

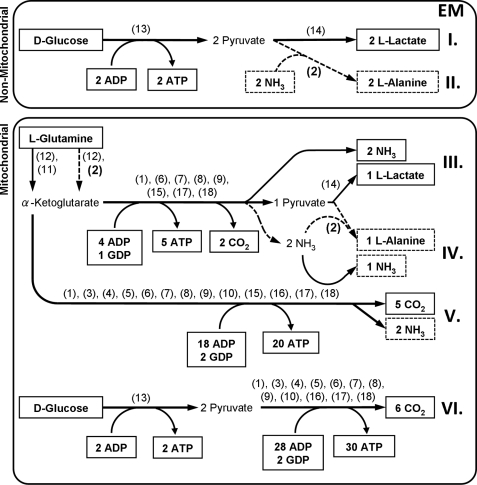
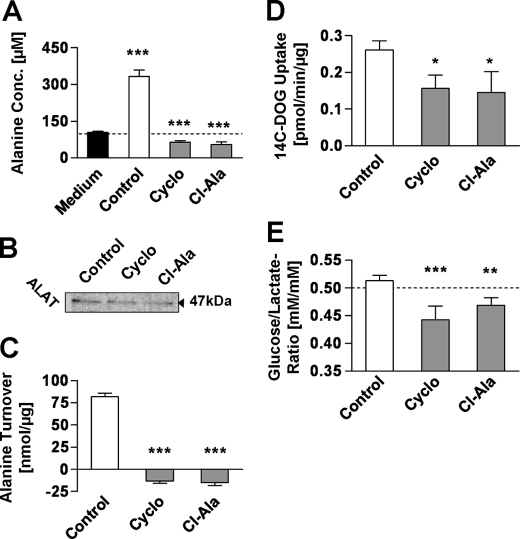
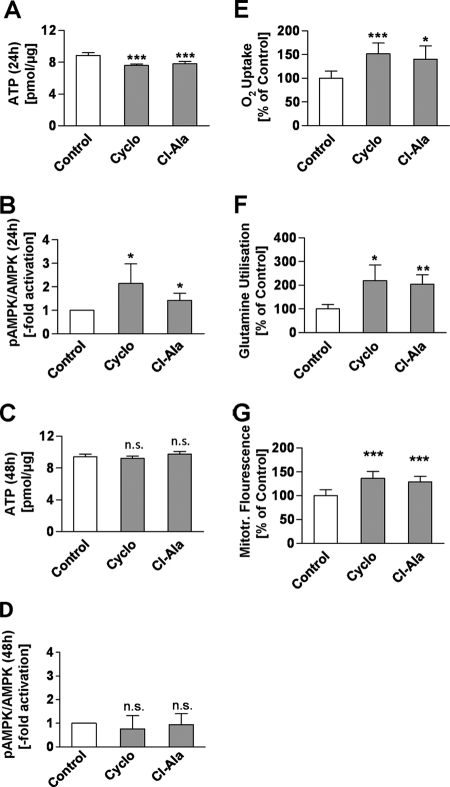
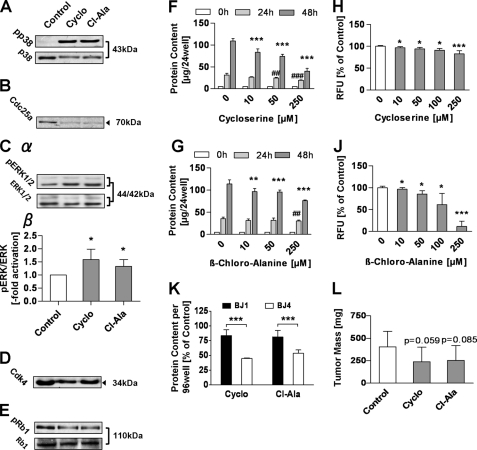
Cancer cells commonly exhibit increased nonoxidative D-glucose metabolism whereas induction of mitochondrial metabolism may impair malignant growth. We have first used an in silico method called elementary mode analysis to identify inhibition of ALAT (L-alanine aminotransferase) as a putative target to promote mitochondrial metabolism. We then experimentally show that two competitive inhibitors of ALAT, L-cycloserine and β-chloro-L-alanine, inhibit L-alanine production and impair D-glucose uptake of LLC1 Lewis lung carcinoma cells. The latter inhibition is linked to an initial energy deficit, as quantified by decreased ATP content, which is then followed by an activation of AMP-activated protein kinase and subsequently increased respiration rates and mitochondrial production of reactive oxygen species, culminating in ATP replenishment in ALAT-inhibited LLC1 cells. Moreover, we observe altered phosphorylation of p38 MAPK (mitogen-activated protein kinase 14), ERK (extracellular signal-regulated kinase 1/2), and Rb1 (retinoblastoma 1) proteins, as well as decreased expression of Cdc25a (cell decision cycle 25 homolog A) and Cdk4 (cyclin-dependent kinase 4). Importantly, these sequelae of ALAT inhibition culminate in similarly reduced anchorage-dependent and anchorage-independent growth rates of LLC1 cells, together suggesting that inhibition of ALAT efficiently impairs cancer growth by counteracting the Warburg effect due to compensatory activation of mitochondrial metabolism.


Figures

FIGURE 1.
FIGURE 1.
Identification of energy-producing pathways in cancer cells using YANAsquare-based elementary mode analysis. I–VI, EM representing pathways with the least amount of enzymes involved to produce ATP from d-glucose or l-glutamine. All framed metabolites are intended to underlie a net production or consumption. Further involved metabolites and co-factors are considered to be compensated by anaplerotic and cataplerotic reactions to form a steady-state metabolite flux and therefore remain hidden, namely, acetyl-CoA, citrate, coenzyme Q, FAD, FADH2, fumarate, GDP, l-glutamate, GTP, d-isocitrate, l-malate, NAD+, NADH/H+, oxaloacetate, pyruvate, succinate, succinyl-CoA, and α-ketoglutarate. The following enzymes and simplified enzyme systems were used for EM determination: (1) ATP-GTP-mutase, (2) ALAT (dashed arrows), (3) citrate synthase, (4) aconitase, (5) isocitrate dehydrogenase, (6) α-ketoglutarate dehydrogenase, (7) succinyl-CoA synthase, (8) succinate dehydrogenase, (9) fumarase, (10) malate dehydrogenase, (11) glutamate dehydrogenase, (12) glutaminase, (13) glycolysis (simplified to an one-step reaction from d-glucose to pyruvate), (14) lactate dehydrogenase, (15) malic enzyme, (16) pyruvate dehydrogenase, (17) NADH/H+ = 2.5 ATP, (18) FADH2 = 1.5 ATP. All enzymes are intended to be unregulated and only dependent on energy-producing substrates.
FIGURE 2.
FIGURE 2.
Inhibitors of ALAT prevent l-alanine production and reduce d-glucose metabolism in cancer cells. A, l-alanine concentration in supernatant medium after a 48-h treatment with inhibitors. B, Western blot of ALAT after a 24-h treatment. C, l-alanine turnover defined as changes in medium l-alanine referred to integral of cellular protein over a 48-h treatment (n = 4). D, 14C-labeled 2OG uptake per μg of protein after a 48-h treatment with inhibitors (n = 4). E, ratio of d-glucose uptake and l-lactate production (n = 4). Inhibitors were used at a final concentration of 250 μm; error bars represent S.D.; *, p < 0.05; **, p < 0.01; ***, p < 0.001.
FIGURE 3.
FIGURE 3.
Inhibitors of ALAT modulate energy metabolism and promote respiration and l-glutamine utilization. A, cellular ATP concentration after a 24-h treatment with inhibitors. B, densitometric analysis of Western blots of phospho-AMPKα protein (pAMPKα) and basal AMPKα protein (n = 5) (A and B after a 24-h treatment with inhibitors). C, cellular ATP concentration/μg of protein (n = 8). D, densitometric analysis of Western blots of phospho-AMPKα protein (pAMPKα) and basal AMPKα protein (n = 3) (C and D after a 48-h treatment). E, cumulative oxygen uptake during a 36-h treatment with inhibitors referred to integral of cellular protein (n = 8). F, l-glutamine utilization, defined as l-glutamine uptake minus l-glutamate excretion during a 48-h treatment referred to integral of cellular protein (n = 4). G, mtROS-related fluorescence after a 24-h treatment normalized for cellular protein content (n = 8). For all panels, inhibitors were used at a final concentration of 250 μm; error bars represent S.D.; *, p < 0.05; **, p < 0.01; ***, p < 0.001).
FIGURE 4.
FIGURE 4.
Inhibitors of ALAT activate stress kinase-dependent pathways and inhibit growth of highly malignant cancer cells. A, Western blots of basal and phosphorylated p38 protein after a 24-h treatment with inhibitors. B, representative Western blot of Cdc25a protein after a 24-h treatment with inhibitors (n = 3). Cα, representative Western blots of basal and phosphorylated ERK protein. Cβ, densitometric analysis of basal and phosphorylated ERK (n = 4) (both after a 24-h treatment with inhibitors). D, representative Western blot of Cdk4 protein after a 24-h treatment with inhibitors (n = 3). E, representative Western blots of basal and phosphorylated Rb protein after a 24-h treatment with inhibitors (n = 3). F and G, protein content per well of anchorage-dependent growing cells after a 0, 24-, and 48-h treatment with Cyclo (F) and Cl-Ala (G). H and J, relative fluorescence units measured per soft agar well of anchorage-independent growing cells treated for 6 days with Cyclo (H) and Cl-Ala (J). K, protein content per well of anchorage-dependent growing BJ1 versus BJ4 cells relative to respective control after a 48-h inhibitor treatment. L, tumor masses in nude mice after 2 weeks of treatment with a daily dose of Cyclo (100 mg/kg of BW) or Cl-Ala (20 mg/kg of BW). A–E and K, inhibitors used at a final concentration of 250 μm; error bars represent S.D.; *, p < 0.05; **, p < 0.01; ***, p < 0.001.

References

    1. Warburg O., Posener K., Negelein E. (1924) Biochem. Zeitschrift. 152, 319–344
    1. Warburg O. (1956) Science 123, 309–314 - PubMed
    1. Semenza G. L., Artemov D., Bedi A., Bhujwalla Z., Chiles K., Feldser D., Laughner E., Ravi R., Simons J., Taghavi P., Zhong H. (2001) Novartis Found. Symp. 240, 251–264 - PubMed
    1. Wallace D. C. (2005) Cold Spring Harbor Symp. Quant. Biol. 70, 363–374 - PubMed
    1. Kim J. W., Dang C. V. (2006) Cancer Res. 66, 8927–8930 - PubMed

Publication types

MeSH terms