. 2011 Jun 24;286(25):22055-68.
doi: 10.1074/jbc.M110.209023. Epub 2011 May 3.

Down-regulation of hepatic urea synthesis by oxypurines: xanthine and uric acid inhibit N-acetylglutamate synthase

Affiliations

Down-regulation of hepatic urea synthesis by oxypurines: xanthine and uric acid inhibit N-acetylglutamate synthase

Itzhak Nissim et al. J Biol Chem. .

Abstract

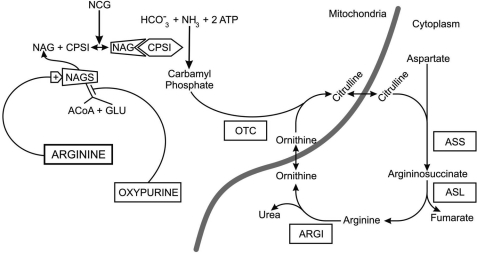
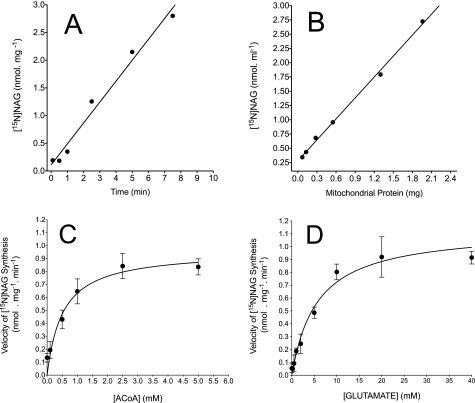
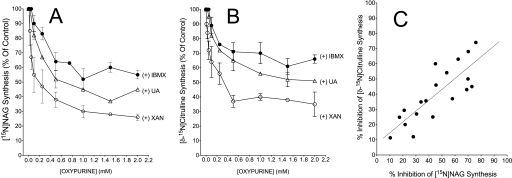
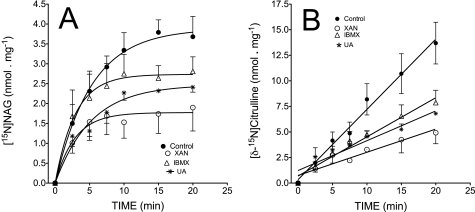
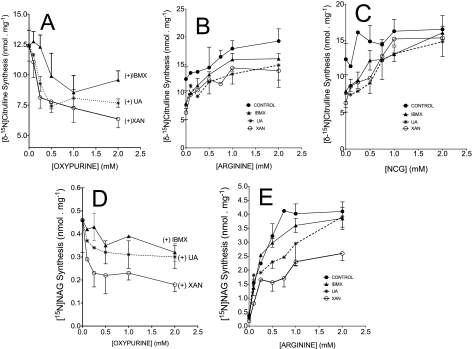
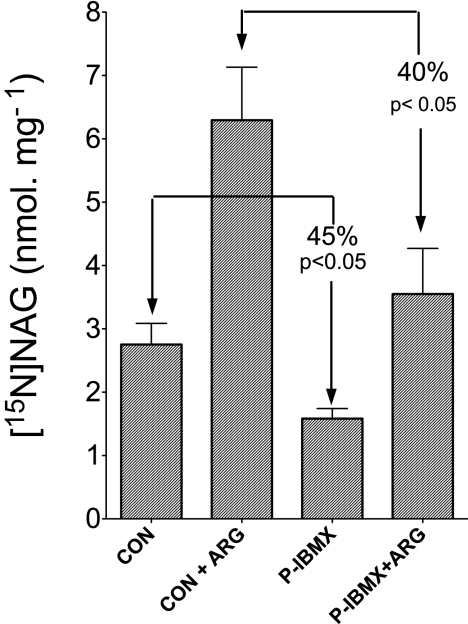
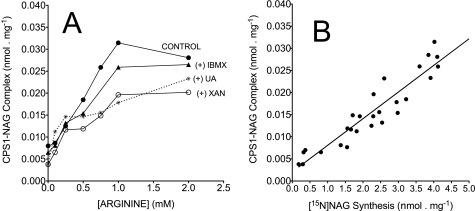
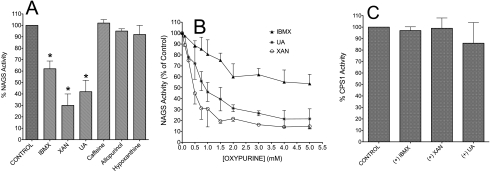
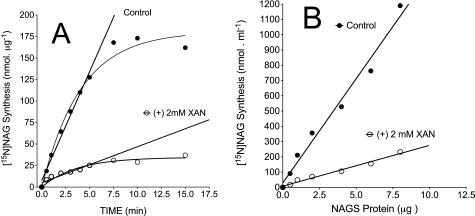
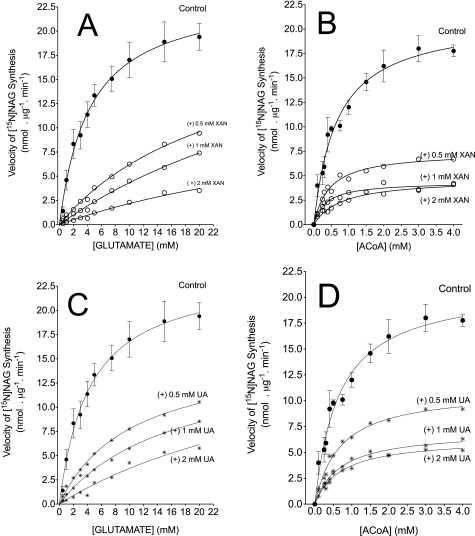
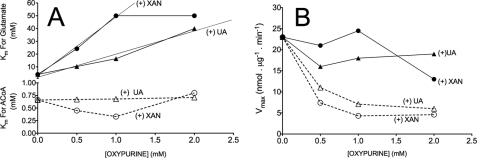
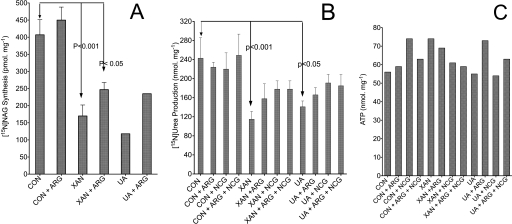
We previously reported that isobutylmethylxanthine (IBMX), a derivative of oxypurine, inhibits citrulline synthesis by an as yet unknown mechanism. Here, we demonstrate that IBMX and other oxypurines containing a 2,6-dione group interfere with the binding of glutamate to the active site of N-acetylglutamate synthetase (NAGS), thereby decreasing synthesis of N-acetylglutamate, the obligatory activator of carbamoyl phosphate synthase-1 (CPS1). The result is reduction of citrulline and urea synthesis. Experiments were performed with (15)N-labeled substrates, purified hepatic CPS1, and recombinant mouse NAGS as well as isolated mitochondria. We also used isolated hepatocytes to examine the action of various oxypurines on ureagenesis and to assess the ameliorating affect of N-carbamylglutamate and/or l-arginine on NAGS inhibition. Among various oxypurines tested, only IBMX, xanthine, or uric acid significantly increased the apparent K(m) for glutamate and decreased velocity of NAGS, with little effect on CPS1. The inhibition of NAGS is time- and dose-dependent and leads to decreased formation of the CPS1-N-acetylglutamate complex and consequent inhibition of citrulline and urea synthesis. However, such inhibition was reversed by supplementation with N-carbamylglutamate. The data demonstrate that xanthine and uric acid, both physiologically occurring oxypurines, inhibit the hepatic synthesis of N-acetylglutamate. An important and novel concept emerging from this study is that xanthine and/or uric acid may have a role in the regulation of ureagenesis and, thus, nitrogen homeostasis in normal and disease states.


Figures

FIGURE 1.
FIGURE 1.
Schematic presentation of the possible action of oxypurines on citrulline and urea synthesis. We proposed that xanthine or uric acid (oxypurines) inhibits NAGS activity and, thus, depletes mitochondrial NAG levels. The result is decreased formation of the CPS1-NAG complex, down-regulation of flux through CPS1, and an impairment of urea synthesis. However, supplementation of N-carbamylglutamate (NCG) and/or an allosteric activation of NAGS by arginine may increase generation of the CPS1-NAG complex and activate CPS1. The result is increased flux through CPS1 and urea synthesis. OTC, ornithine transcarbamylase; ARGI, arginase-I; ASS, argininosuccinate synthetase; ASL, argininosuccinate lyase; GLU, glutamate.
FIGURE 2.
FIGURE 2.
Linearity and kinetic parameters for N-acetylglutamate synthetase in mitochondrial lysates. Experiments were carried out with mitochondrial lysates prepared from the liver of overnight fasted rats. A, activity of NAGS versus times of incubation. Mitochondrial lysates (2 mg/ml protein) were incubated for the times indicated with basic medium (see “Experimental Procedures”) plus 5 mm MgATP, 5 mm ornithine, 1 mm acetyl-CoA, 10 mm [15N]glutamate, and 1 mm 15NH4Cl. B, activity of NAGS versus increasing amounts of mitochondrial lysate protein. Incubations for 5 min were performed with various lysate protein, as indicated, and with basic medium (see “Experimental Procedures”) plus 5 mm MgATP, 5 mm ornithine, 1 mm acetyl-CoA, 10 mm [15N]glutamate, and 1 mm 15NH4Cl. C and D, velocity of [15N]NAG synthesis by the current mitochondrial lysate preparation. Incubations for 5 min were carried out with basic medium and either varied [ACoA] and fixed 40 mm [15N]glutamate (C) or varied [15N]glutamate concentrations and fixed (5 mm) ACoA (D). Data points in A and B represent the means of two experiments. Data points in C and D are means ± S.D. of 3–4 measurements performed on 3–4 independent mitochondrial lysate preparations.
FIGURE 3.
FIGURE 3.
Dose dependence of oxypurine-induced inhibition of 15N-labeled NAG and citrulline synthesis. Experiments were carried out with mitochondrial lysates as a source of NAGS and CPS1. Mitochondrial lysates (∼2 mg/ml protein) were incubated for 20 min with basic medium (see “Experimental Procedures”) plus 5 mm MgATP, 5 mm ornithine, 0.5 mm acetyl-CoA, 10 mm [15N]glutamate, 1 mm 15NH4Cl, and increasing concentrations of oxypurine as indicated. A, flux through NAGS (percentage of control), as determined by synthesis of [15N]NAG. B, production of [δ-15N]citrulline synthesis (percentage of control) as a proxy for flux through CPS1. C, relationship between percentage inhibition of flux through CPS1 and flux through NAGS obtained from data in A and B. The mean control value for [15N]NAG synthesis was about 4.12 ± 0.12 nmol/mg, and the mean control value for [δ-15N]citrulline synthesis was about 25 ± 8 nmol/mg. Data points with error bars represent mean ± S.D. of 3–4 independent experiments. Data points without error bars are the mean of two independent experiments.
FIGURE 4.
FIGURE 4.
Time dependence of oxypurine-induced inhibition of [15N]NAG and [δ-15N]citrulline synthesis. Mitochondrial lysates were incubated for various times with medium as outlined in the legend to Fig. 3 with or without 1 mm xanthine, uric acid, or IBMX as indicated. A, time dependence of oxypurine action on production of [15N]NAG. We first determined the concentration of NAG by isotope dilution and then calculated the rate of [15N]NAG synthesis by the product of the initial (before spiking the sample) 15N enrichment, mol % excess/100 × concentration (nmol/mg protein). B, simultaneous production of [δ-15N]citrulline represented by the product of total citrulline concentration (nmol/mg protein) × 15N enrichment, mol % excess/100. The lines present the best fit to one-phase exponential association (Y = Ymax*(1 − ekt) of data in A or linear correlation of data in B. Data points with error bars are means ± S.D. of 3–4 independent experiments. Data points without error bars are means of two independent experiments.
FIGURE 5.
FIGURE 5.
Oxypurine-induced inhibition of [15N]NAG and [δ-15N]citrulline synthesis in intact mitochondria; protection by supplementation of N-carbamylglutamate or arginine. Incubations with intact mitochondria (2 mg of protein) were carried out with iso-osmotic medium (300 mosm) for 15 min. The medium consists of basic medium (see “Experimental Procedures”) plus 5 mm ornithine, 0.1 mm acetyl-CoA, 10 mm [15N]glutamate, 1 mm 15NH4Cl, 5 mm pyruvate, and 5 mm ADP (respiring on pyruvate). A, inhibition of [δ-15N]citrulline synthesis with an increasing concentration of the indicated oxypurine without activator. B, synthesis of [δ-15N]citrulline synthesis with fixed 2 mm oxypurine and an increasing concentration of arginine as indicated. C, synthesis of [δ-15N]citrulline synthesis with fixed 2 mm oxypurine and an increasing concentration of N-carbamylglutamate (NCG). D and E, synthesis of [15N]NAG with an increasing concentration of oxypurine (D) or fixed 2 mm oxypurine and an increasing concentration of arginine (E). Data points are means ± S.D. (error bars) of three independent experiments.
FIGURE 6.
FIGURE 6.
The inhibition of NAGS activity was sustained following preincubation with IBMX. Intact mitochondria were preincubated for 20 min at room temperature with medium consisting of 50 mm Tris, 1 mm EDTA, 5 mm KCl, 5 mm MgCl2, 15 mm KHCO3, and 5 mm KH2PO4 and 2 mm IBMX dissolved in 5% DMSO (P-IBMX). Control (CON) preincubation was performed with an equal amount of DMSO without IBMX. Thereafter, mitochondrial pellets were separated from IBMX by centrifugation and then were washed with basic medium containing 5% DMSO by a second round of centrifugation (see “Experimental Procedures”). Mitochondria from control underwent similar centrifugation and were washed with DMSO. Then mitochondrial pellets obtained following preincubation with IBMX or control with only DMSO were reincubated for 5 min with medium containing 2.5 mm ADP, 5 mm pyruvate (respiring on pyruvate), 5 mm ornithine, 0.5 mm acetyl-CoA, 5 mm [15N]glutamate, 1 mm 15NH4Cl. CON, control; CON + ARG, control plus 1 mm arginine; P-IBMX, following preincubation with IBMX; P-IBMX + ARG, following preincubation with IBMX plus 1 mm arginine. Each histogram represents the mean ± S.D. (error bars) of three independent experiments. The percentage represents the differences between the indicated experimental conditions.
FIGURE 7.
FIGURE 7.
The relationship between the level of newly synthesized [15N]NAG and the calculated level of the CPS1-NAG complex. The level of CPS1-NAG complex was calculated using the assumption that CPS1 + NAG ↔ CPS1-NAG is at near equilibrium (35), with a dissociation constant of the CPS1 for NAG of 1 × 10⁻⁴ m (6), and, thus, [CPS1] × [NAG]/[CPS1-NAG] = 10−4 m. We estimated the concentration of CPS1 as 22% of mitochondrial matrix protein (6). Total NAG concentration (nmol/mg protein) was determined by isotope dilution (19, 31), with each arginine concentration added in experiments with intact mitochondria (CONTROL, IBMX, XAN, and UA are as indicated in Fig. 5E). A, calculated CPS1-NAG complex without oxypurine (CONTROL) or with fixed 2 mm oxypurine and increasing concentrations of arginine as indicated in Fig. 5E. B, a linear correlation between the calculated [CPS1-NAG] and the newly synthesized [15N]NAG following a 15-min incubation. The level of newly synthesized [15N]NAG was calculated by the product of the initial (before spiking the sample) 15N enrichment, mol % excess/100 × concentration of total NAG (nmol/mg protein). Data points of [15N]NAG are taken from experiments described in the legend to Fig. 5E (CON, IBMX, XAN, and UA) and are plotted against the corresponding calculated level of the CPS1-NAG complex indicated in A (r2 = 0.9 and p < 0.0001).
FIGURE 8.
FIGURE 8.
The action of oxypurine on the activity of the recombinant NAGS or purified hepatic CPS1. A, action of a fixed concentration of oxypurines (1 mm) on percentage of NAGS activity. Assays were performed with fixed 1 mm ACoA and 10 mm [15N]glutamate. The reaction was carried out at 30 °C for 5 min in 250 μl of 50 mm Tris-HCl buffer, pH 8.5, containing about 2.5 μg of enzyme and 1 mm arginine. B, NAGS activity (percentage of control) with increasing concentrations of the indicated oxypurine. Assays were performed as indicated in A. 100% of NAGS activity (control value without oxypurine) was about 25 nmol/μg/min. C, percentage of CPS1 activity with fixed concentration (6, 5, or 3 mm) of IBMX, XAN, or UA, respectively. Results are expressed as a percentage of the enzyme activity in the absence of the indicated oxypurine. The 100% CPS1 activity was about 3.2 nmol/mg/min, as determined by formation of ADP (see “Experimental Procedures”). The CPS1 amount used was 2.5–2.8 μg/ml. Data points are mean ± S.D. (error bars) of three independent experiments.
FIGURE 9.
FIGURE 9.
Linearity of recombinant NAGS activity with regard to time and enzyme protein; determination with or without xanthine. A, time course of NAGS activity. The reaction was performed at 30 °C for the indicated times in a total reaction volume of 250 μl, containing 50 mm Tris-HCl buffer, pH 8.5, 2.5 μg of enzyme protein, 1 mm arginine, and fixed 1 mm ACoA and 10 mm [15N]glutamate. B, reactions performed with various enzyme protein, as indicated, at 30 °C in a total reaction volume of 250 μl, containing 50 mm Tris-HCl buffer, pH 8.5, 1 mm arginine, and fixed 1 mm ACoA and 10 mm [15N]glutamate. Determinations were performed without xanthine (control) or with the addition of 2 mm xanthine. Data points are means of two independent experiments.
FIGURE 10.
FIGURE 10.
The velocity of recombinant NAGS as a function of xanthine or uric acid concentrations. The reaction was performed at 30 °C for 5 min in 250 μl of 50 mm Tris-HCl buffer, pH 8.5, containing 2.5 mg of enzyme and 1 mm arginine. A and B, velocity of [15N]NAG synthesis in the presence of various concentrations of XAN as indicated and with either varied [[15N]glutamate] and fixed 1 mm ACoA (A) or varied [ACoA] and fixed (10 mm) [15N]glutamate (B). C and D, velocity of [15N]NAG synthesis in the presence of various concentrations of UA, as indicated, and with either varied concentrations of [15N]glutamate and fixed (1 mm) ACoA (C) or varied [ACoA] and fixed (10 mm) [15N]glutamate (D). The control parameters (without oxypurine) are mean ± S.D. (error bars) of 3–4 determinations performed with an independent preparation of recombinant NAGS. Parameters obtained with the addition of xanthine or uric acid are means of two determinations performed with an independent preparation of recombinant NAGS.
FIGURE 11.
FIGURE 11.
The relationship between an increasing concentration of oxypurine and the Km values for glutamate or acetyl-CoA and the resulting Vmax for NAGS. A, Km values for glutamate or acetyl-CoA obtained with increasing concentration of oxypurine; B, the corresponding Vmax for NAGS. Both Km and Vmax values were taken from Table 3. Solid lines, Km values or Vmax obtained with varied concentrations of [15N]glutamate] and fixed 1 mm [ACoA]; dashed lines, Km values or Vmax obtained with varied [ACoA] and fixed (10 mm) [15N]glutamate. The straight lines in A (Km for glutamate) represent the best fit to a linear correlation for xanthine, r2 = 0.94, in the range of 0–1 mm (p = 0.04), and for uric acid, r2 = 0.99, in the range of 0–2 mm (p = 0.01). Experimental details are as indicated in the legend to Fig. 10.
FIGURE 12.
FIGURE 12.
Xanthine or uric acid inhibits 15N-labeled NAG and urea synthesis in isolated hepatocytes; the action of N-carbamylglutamate (NCG) or arginine supplementation. Isolated hepatocytes were incubated for 60 min in Krebs medium plus 5 mm [5-15N]glutamine, 1 mm 15NH4Cl, 10 mm lactate, 1.5 mm pyruvate and with or without 1 mm oxypurine or oxypurine plus 0.5 mm activator, as indicated. A, amount of newly synthesized 15N-labeled NAG following a 60-min incubation. 15N-Labeled NAG was formed from 15N-labeled glutamate. The latter was generated from 15NH3 via reductive amination of α-ketoglutarate in the mitochondrial compartment, as indicated (36). The amount of [15N]NAG was calculated as follows. We first determined the concentration of NAG by isotope dilution (19, 31) and then calculated the level of [15N]NAG by the product of the initial (before spiking the sample) 15N enrichment, mol % excess/100 × concentration (nmol/mg protein). B, production of [15N]urea, which is the sum of Um+1 and Um + 2 isotopomers (urea contains one 15N or two 15N) obtained by the product of total urea (nmol/mg protein) times 15N enrichment (atom % excess/100) as indicated (31). C, levels of ATP in hepatocytes at the end of the incubation. p values were obtained using Prism-5 software and one-way analysis of variance comparing the indicated (by arrows) experimental conditions with control without oxypurine (CON). Error bars, S.D.

References

    1. Meijer A. J., Lamers W. H., Chamuleau R. A. (1990) Physiol. Rev. 70, 701–748 - PubMed
    1. Gropman A. L., Summar M., Leonard J. V. (2007) J. Inherit. Metab. Dis. 30, 865–879 - PMC - PubMed
    1. Ahuja V., Powers-Lee S. G. (2008) J. Inherit. Metab. Dis. 31, 481–491 - PubMed
    1. Holden H. M., Thoden J. B., Raushel F. M. (1999) Cell Mol. Life Sci. 56, 507–522 - PMC - PubMed
    1. McCudden C. R., Powers-Lee S. G. I. (1996) J. Biol. Chem. 271, 18285–18294 - PubMed

Publication types

MeSH terms

LinkOut - more resources