. 2011 Jun 24;286(25):22227-34.
doi: 10.1074/jbc.M111.228874. Epub 2011 May 3.

Sirtuin 1 (SIRT1) protein degradation in response to persistent c-Jun N-terminal kinase 1 (JNK1) activation contributes to hepatic steatosis in obesity

Affiliations

Sirtuin 1 (SIRT1) protein degradation in response to persistent c-Jun N-terminal kinase 1 (JNK1) activation contributes to hepatic steatosis in obesity

Zhanguo Gao et al. J Biol Chem. .

Abstract

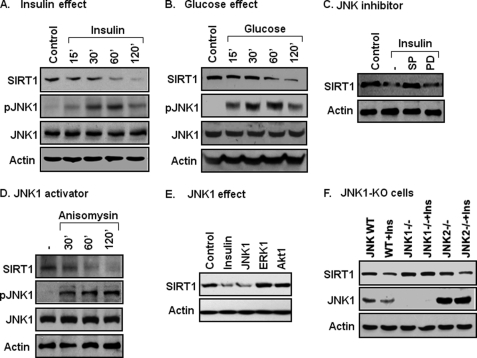
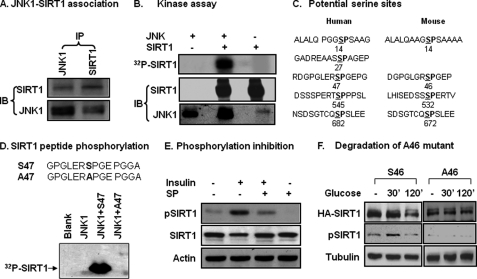
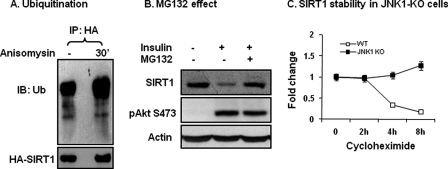
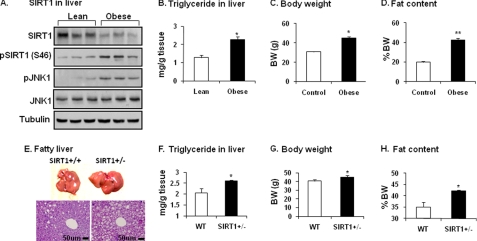
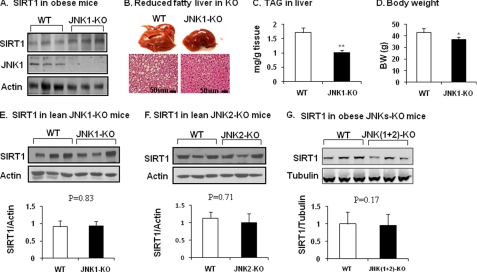
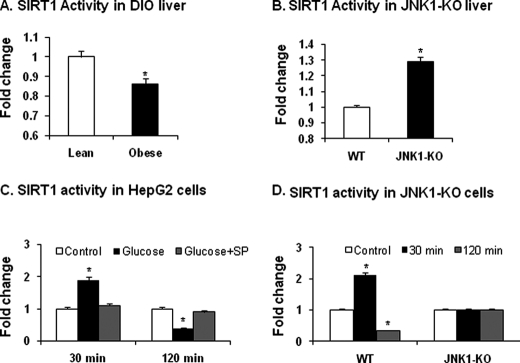
SIRT1 is involved in the pathogenesis of obesity, diabetes, and aging. However, it is not clear how SIRT1 activity is regulated by intracellular kinases in cells. In this study, we investigated SIRT1 phosphorylation and protein degradation in response to JNK1 activation in obese mice. Mouse SIRT1 is phosphorylated by JNK1 at Ser-46 (Ser-47 in human SIRT1), which is one of the four potential residues targeted by JNK1. The phosphorylation induces a brief activation of SIRT1 function and degradation of SIRT1 thereafter by the proteasome. Ubiquitination occurs in SIRT1 protein after the phosphorylation. Mutation of Ser-46 to alanine prevents the phosphorylation, ubiquitination, and degradation. In vivo, SIRT1 undergoes an extensive degradation in hepatocytes in obesity as a consequence of persistent activation of JNK1. The degradation leads to inhibition of SIRT1 function, which contributes to development of hepatic steatosis. The degradation disappears in obesity when JNK1 is inactivated in mice. JNK2 exhibits an opposite activity in the regulation of SIRT1 degradation. The JNK1-SIRT1 pathway provides a new molecular mechanism for the pathogenesis of hepatic steatosis in obesity.


Figures

FIGURE 1.
FIGURE 1.
Association of JNK1 activation and SIRT1 protein reduction. A, insulin effect is shown. SIRT1 protein reduction was induced with insulin (200 nm) in 3T3-L1 cells. SIRT1 protein and pJNK were measured in whole cell lysates in an immunoblot. B, glucose effect is shown. SIRT1 reduction was induced with glucose (50 mm) in 3T3-L1 cells in serum-free DMEM medium (0.25% BSA). C, inhibition of SIRT1 reduction is shown. Cells were pretreated with the JNK inhibitor SP600125 (SP, 50 μm) or MEK inhibitor PD98059 (PD, 30 μm) for 30 min followed by insulin treatment (120 min). D, JNK activator effect is shown. Anisomycin (5 μg/ml) was used to activate JNK, leading to SIRT1 reduction. E, JNK1 overexpression effect is shown. Activities of JNK1, ERK1, and Akt1 were tested for their ability to reduce SIRT1 in a transient transfection of 293 cells with the expression vectors. SIRT1 protein was quantified at 48 h after transfection. F, SIRT1 in JNK-KO cells is shown. SIRT1 protein was measured in an immunoblot after insulin treatment for 2 h. All the experiments were repeated at least three times with consistent results.
FIGURE 2.
FIGURE 2.
Phosphorylation of SIRT1 by JNK1. A, JNK1 and SIRT1 association is shown. IP was conducted to detect protein-protein association in the 293 cell lysates (400 μg/point) after anisomycin treatment (5 μg/ml) for 30 min. B, an in vitro kinase assay is shown. The recombinant mouse HA-JNK1 was tested for its ability to phosphorylate the HA-SIRT1 protein in a kinase assay. Assay products were resolved in SDS-PAGE and transferred onto a polyvinylidene difluoride membrane for autoradiography (32P) or immunoblotting (IB). C, shown is a sequence analysis of human and mouse SIRT1. The serine position is indicated by the number. D, a kinase assay with synthesized human SIRT1 peptides is shown. WT and mutant (Ser-Ala) peptides for Ser-47 were used as substrates in the kinase assay. E, SIRT1 phosphorylation was detected by a phospho-specific antibody in cell lysate. Whole cell lysates were made after JNK1 activation by insulin or inhibition by SP600125 (SP) in 3T3-L1 adipocytes. SIRT1 phosphorylation was measured using the phospho-specific antibody to the human SIRT1 Ser-47 (equivalent to mouse Ser-46) in an immunoblot. F, inhibition of SIRT1 reduction by Ser-46 mutation is shown. Reduction of mouse WT (Ser-46) and mutant (Ala-46) SIRT1 proteins were tested in SIRT1−/− MEF cells in a transient transfection. Protein abundance and phosphorylation status were determined after glucose (50 mm) treatment for 2 h. All experiments were repeated at least three times with consistent results.
FIGURE 3.
FIGURE 3.
Ubiquitination and proteasome-mediated degradation. A, ubiquitination is shown. HA-SIRT1 was expressed in 293 cells and collected after JNK activation using the anti-HA antibody through IP. Ubiquitination of the SIRT1 protein was determined using the ubiquitin antibody. IB, immunoblot. B, proteasome effect is shown. The proteasome inhibitor MG132 (50 μm) was used to pretreat 3T3-L1 adipocytes for 30 min. SIRT1 degradation was induced by insulin (200 nm, 2 h). Phosphorylation of Akt Ser-473 was used as a control of insulin signaling. C, SIRT1 protein stability is shown. WT and JNK1-KO MEF cells were compared for SIRT1 protein half-life. Protein synthesis was inhibited with cycloheximide. SIRT1 protein abundance was measured in whole cell lysates at multiple time points (h).
FIGURE 4.
FIGURE 4.
Decreased SIRT1 in liver of obese mice. A, shown is SIRT1 protein in the liver of DIO mice. SIRT1 protein was measured after tissue homogenization of liver from DIO mice (HFD for 22 weeks). Phosphorylation of SIRT1 and JNK was determined using phospho-specific antibodies. B, TAG in liver is shown. TAG content was determined in liver tissue. C, mouse body weight (BW) at 22 weeks on HFD is shown. D, mouse body fat content at 22 weeks on HFD is shown. Data in panels B–D are presented as the means ± S.E. (n = 10). E, fatty liver in SIRT1+/− mice on HFD is shown. The liver was examined in SIRT1+/− mice at 26 weeks on HFD. Hepatic steatosis is indicated by liver size (picture) and lipid droplets (tissue slide with hematoxylin and eosin staining). F, triglyceride in the livers of mice is shown. G, body weight of the mice is shown. H, body fat content of the mice is shown. Data in panels F–H are presented as the means ± S.E. (n = 8). *, p < 0.05; **, p < 0.001 by Student's t test.
FIGURE 5.
FIGURE 5.
SIRT1 protein in JNK1-KO mice. A, SIRT1 protein in liver tissues is shown. JNK1-KO mice were fed HFD for 22 weeks. SIRT1 protein was determined in the liver tissue homogenate. B, shown is protection of JNK1-KO mice from development of fatty liver. Hepatic steatosis is indicated by liver size (picture) and lipid droplet (slide with hematoxylin and eosin staining). C, triglyceride in liver is shown. D, body weight (BW) is shown. The data in panels C and D are presented as the means ± S.E. (n = 8). E, SIRT1 in lean JNK1-KO mice is shown. SIRT1 protein was determined in the liver of mice on chow diet. F, SIRT1 in lean JNK2-KO mice is shown. SIRT1 protein was determined in the liver of mice on chow diet. G, SIRT1 in obese mice with liver-specific JNK1/2 KO. SIRT1 protein was determined in the liver of double KO mice at 16 weeks on HFD. *, p < 0.05; **, p < 0.001 by Student's t test.
FIGURE 6.
FIGURE 6.
Catalytic activity of SIRT1. A, catalytic activity of SIRT1 in the liver of DIO mice is shown. The test was conducted using the nuclear protein extract from liver tissues of DIO mice fed HFD for 22 weeks. B, catalytic activity of SIRT1 in JNK1-KO mice is shown. The nuclear extract of liver tissues was made from mice at 22 weeks on HFD. C, catalytic activity of SIRT1 is shown. Histone deacetylase activity was examined in the nuclear extract of HepG2 hematoma cells at 30 and 120 min after glucose treatment. JNK inhibitor SP600125 (SP) was used to pretreat the cells for 30 min before glucose treatment. D, catalytic activity of SIRT1 in JNK1-KO MEFs is shown. The assay in panel C was repeated in JNK1-KO MEFs. The data in this figure are presented as the mean ± S.E. (n = 10). *, p < 0.05 by Student's t test.

References

    1. Blander G., Guarente L. (2004) Annu. Rev. Biochem. 73, 417–435 - PubMed
    1. Imai S., Armstrong C. M., Kaeberlein M., Guarente L. (2000) Nature 403, 795–800 - PubMed
    1. Lin S. J., Defossez P. A., Guarente L. (2000) Science 289, 2126–2128 - PubMed
    1. Rodgers J. T., Lerin C., Haas W., Gygi S. P., Spiegelman B. M., Puigserver P. (2005) Nature 434, 113–118 - PubMed
    1. Liu Y., Dentin R., Chen D., Hedrick S., Ravnskjaer K., Schenk S., Milne J., Meyers D. J., Cole P., Yates J., 3rd, Olefsky J., Guarente L., Montminy M. (2008) Nature 456, 269–273 - PMC - PubMed

Publication types

MeSH terms