. 2011 Sep;4(5):686-700.
doi: 10.1242/dmm.007237. Epub 2011 May 2.

A comprehensive assessment of the SOD1G93A low-copy transgenic mouse, which models human amyotrophic lateral sclerosis

Affiliations

A comprehensive assessment of the SOD1G93A low-copy transgenic mouse, which models human amyotrophic lateral sclerosis

Abraham Acevedo-Arozena et al. Dis Model Mech. 2011 Sep.

Abstract

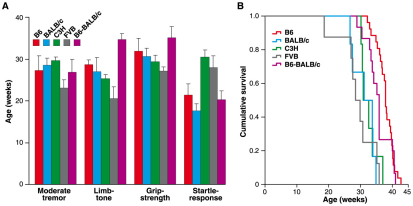
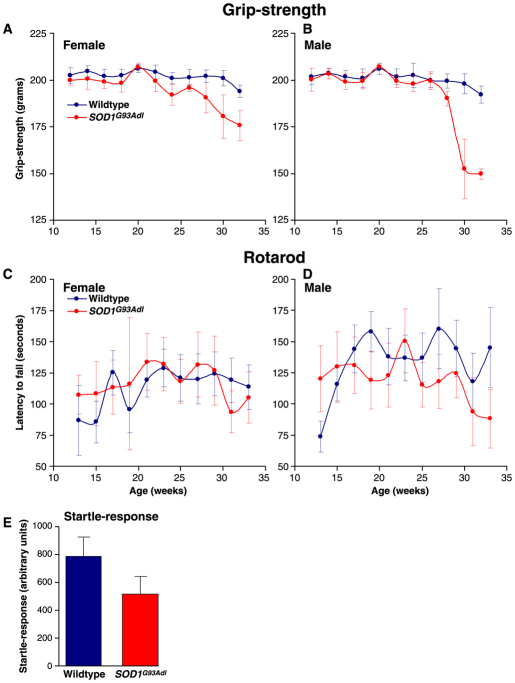
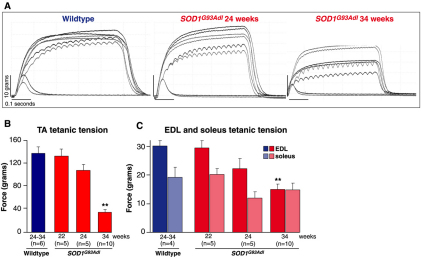
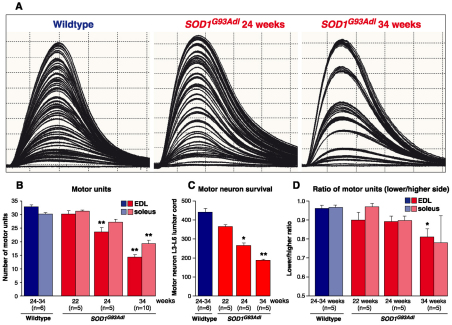
Amyotrophic lateral sclerosis (ALS) is a progressive neurodegenerative disorder that results in the death of motor neurons in the brain and spinal cord. The disorder generally strikes in mid-life, relentlessly leading to paralysis and death, typically 3-5 years after diagnosis. No effective treatments are available. Up to 10% of ALS is familial, usually autosomal dominant. Several causative genes are known and, of these, mutant superoxide dismutase 1 (SOD1) is by far the most frequently found, accounting for up to 20% of familial ALS. A range of human mutant SOD1 transgenic mouse strains has been produced, and these largely successfully model the human disease. Of these, the most widely used is the SOD1 mouse, which expresses a human SOD1 transgene with a causative G93A mutation. This mouse model is excellent for many purposes but carries up to 25 copies of the transgene and produces a great excess of SOD1 protein, which might affect our interpretation of disease processes. A variant of this strain carries a deletion of the transgene array such that the copy number is dropped to eight to ten mutant SOD1 genes. This 'deleted' 'low-copy' mouse undergoes a slower course of disease, over many months. Here we have carried out a comprehensive analysis of phenotype, including nerve and muscle physiology and histology, to add to our knowledge of this 'deleted' strain and give baseline data for future studies. We find differences in phenotype that arise from genetic background and sex, and we quantify the loss of nerve and muscle function over time. The slowly progressive pathology observed in this mouse strain could provide us with a more appropriate model for studying early-stage pathological processes in ALS and aid the development of therapies for early-stage treatments.


Figures

Fig. 1.
Fig. 1.
Behavioural analysis of SOD1G93Adl on different genetic backgrounds. (A) SHIRPA analysis. Mice underwent modified SHIRPA once every 2 weeks from 12 weeks of age. Bars represent the average age at onset for tremors, limb tone, grip strength and startle response. Error bars represent s.e.m. Onset of all phenotypes is significantly different (log-rank P<0.001) when comparing between all SOD1G93Adl transgenic lines. (B) Survival. SOD1G93Adl mice reach the humane endpoint at different times, depending on genetic background (sex-averaged data; log-rank P<0.001).
Fig. 2.
Fig. 2.
Grip-strength, startle-response and rotarod analysis of SOD1G93Adl B6 mice. (A) Female grip strength. At least five females per genotype were assessed for every time point except for week 20, when two SOD1G93Adl B6 females were assessed. Grip strength deteriorates in SOD1G93Adl females compared with wild-type littermates, with differences starting to appear from 24 weeks of age (ANOVA; 24 weeks: P=0.006; 26 weeks: P=0.073; 28 weeks: P=0.007; 30 weeks: P=0.001 and 32 weeks: P=0.003). The figure represents the average plus 2 s.e.m. per genotype and time point. (B) Male grip strength. At least five males per genotype were assessed for each time point except for week 20, when four wild-type males were assessed. Grip strength rapidly deteriorates in SOD1G93Adl males compared with wild-type littermates from 28 weeks of age (ANOVA; 28 weeks: P=0.005; 30 and 32 weeks: P<0.001). The figure represents the average plus 2 s.e.m. per genotype and time point. By 30 weeks of age the difference between grip strength of SOD1G93Adl B6 males and females is significant (P=0.020), as it is by 32 weeks of age (P=0.001). (C) Female rotarod. At least five females per genotype were assessed for each time point. No statistically significant differences in latency to fall were detected at any time point. The figure represents the average plus 2 s.e.m. per genotype and time point. (D) Male rotarod. At least five males per genotype were assessed for each time point. Rotarod performances deteriorate in SOD1G93Adl B6 males when compared with littermate controls, with significant differences appearing at 27 weeks (P=0.039) and 33 weeks (P=0.009) of age. The figure represents the average plus 2 s.e.m. per genotype and time point. (E) Startle response. 20 (8 females, 12 males) littermate controls and 13 (7 females, 6 males) SOD1G93Adl B6 mice were tested at 22 weeks of age (sex-averaged difference between wild types and SOD1G93Adl B6 littermates, P=0.011; females only P=0.025; males only P=0.232). Data are presented pooled by sex because no sex bias for any genotype was detected. Deficits on startle response were confirmed at 29 weeks of age (P=0.002, males only tested; data not shown). No differences are found in PPI (data not shown). Bars represent the average startle response per genotype. Error bars represent 2 s.e.m.
Fig. 3.
Fig. 3.
Assessment of hindlimb muscle force production. (A) Characteristic traces obtained from TA muscles of wild-type mice (24–34 weeks of age), and 24-week- and 34-week-old and SOD1G93Adl B6 mice by stimulating the sciatic nerve by supramaximal single twitch and tetanic stimuli using variable frequencies for tetanic stimulation from 40 to 100 Hz. (B) Summary of tetanic force production by TA muscles in wild-type and SOD1G93Adl B6 mice at 22, 24 and 34 weeks of age. Maximum tetanic force of TA muscles was 137±12 g (n=10) in wild-type mice aged between 24 and 34 weeks, and 130±13 g (n=5; P=0.09) and 107±11 g (n=5; P=0.08) in 22- and 24-week old SOD1G93Adl littermates, respectively. At 34 weeks of age the TA muscle of SOD1G93Adl mice is only capable of exerting 33.8±5 g force, which is ∼70% less than the 137±12 g force produced by TA in wild-type littermates (**P<0.001). (C) Tetanic force production by the EDL and soleus muscles in wild-type and SOD1G93Adl B6 mice at 22, 24 and 34 weeks of age. The tetanic force of EDL was 30±1.9 g in wild-type mice, and 29.3±2.5 g (P=0.09) and 22.2±3.5 g (P=0.18) in SOD1G93Adl littermates at 22 and 24 weeks, respectively. In the soleus, the maximum force was 19±3.5 g in wild-type mice, and 20±1.9 g (P=0.24) and 12±4 g (P=0.13) in SOD1G93Adl littermates at 22 and 24 weeks, respectively. By 34 weeks of age, the EDL exerts 14.9±1.8 g force in SOD1G93Adl mice, compared with 30±1.9 g in wild-type littermates, a reduction of 50% (**P<0.001). At 34 weeks of age the soleus muscle in SOD1G93Adl mice exerts 14.8±2.8 g force, compared with 19±3.5 g in wild-type littermates, which is a reduction of ∼20% (P=0.1).
Fig. 4.
Fig. 4.
Physiological and morphological analysis of motor units and motor neuron survival. (A) Physiological analysis of the number of motor units innervating EDL muscles of wild-type mice (24–34 weeks of age), and 24- and 34-week-old SOD1G93Adl B6 mice was undertaken; typical traces are shown. Each twitch trace in the recordings represents a single motor unit. (B) The number of surviving motor units for EDL and soleus muscles in wild-type and SOD1G93Adl B6 mice at different stages of disease (22, 24 and 34 weeks of age) are summarised. No significant differences are found at 22 weeks of age. At 24 weeks, only 23±1.6 motor units survived in SOD1G93Adl B6 mice compared with 32.8±0.7 motor units in EDL muscles of wild-type littermates (P<0.001). By 34 weeks, only 14.2±0.9 motor units survived in the EDL muscles of SOD1G93Adl mice. (C) Morphological assessment of motor neuron survival in the L3-L6 region of the lumbar spinal cord was undertaken and the mean survival of motor neuron in the sciatic motor pool is shown. At 22 weeks of age, wild-type littermates had 439±23 motor neurons in the sciatic motor pool compared with 362±12 in 22-week-old SOD1G93Adl mice (P=0.571). By 24 weeks there was a significant decrease in motor neuron survival compared with wild-type littermate controls, and only 264±12 motor neurons survived in the SOD1G93Adl sciatic motor pool (P<0.05). By 34 weeks, the number of SOD1G93Adl surviving motor neurons was dramatically reduced and only 185±5.6 motor neurons were present in the sciatic motor pool (P<0.001). (D) Analysis of asymmetry in the number of surviving motor units between two sides in each animal is summarised. For each mouse, a ratio of the number of motor units in the weaker side over that on the stronger side was generated and compared with the wild-type group. *P<0.05; **P<0.001.
Fig. 5.
Fig. 5.
Muscle pathology in SOD1G93Adl B6 mice. (A) Characteristic fatigue traces from 24- to 34-week-old wild-type and SOD1G93Adl mice, generated by tetanic stimulation of the fast EDL muscle over 180 seconds are shown on the left panels. Each tetanic contraction during this time is represented by a single line in the trace and the length of the line is relative to the force produced. The length of the force trace at Ft180 (time = 180 seconds) as a ratio of that at Ft0 gives a fatigue index (FI), i.e. FI=Ft180/Ft0. Wild-type mice lose a large proportion of force at the end of the 180-second stimulation period compared with the beginning of the trace; thus, wild-type muscles have a low FI. By contrast, in old SOD1G93Adl mice, the EDL muscle is less fatigable and this is indicated by the higher FI. On the right of each trace is a cross-section of the TA muscle obtained from wild-type mice, and 24- and 34-week-old SOD1G93Adl mice, stained for SDH. In the TA muscle there is a characteristic pattern of SDH staining, with the presence of darkly stained, oxidative type 1 fibres in the centre of the muscle and lightly stained, less oxidative and more likely to be fast type II fibres towards the outer regions of the muscle. Compared with wild-type mice, SDH staining in 24-week-old SOD1G93Adl mice shows that a large area in the centre of the muscle stains darkly for SDH, with a smaller outer region of the muscle staining lighter, indicating a transformation of a subset of muscle fibres into a slower phenotype. This transformation is even more apparent at 34 weeks in SOD1G93Adl mice. (B) Summary of FI in EDL and soleus muscles of wild-type and SOD1G93Adl B6 mice at different stages of disease, showing a functional consequence of the muscle fibre type shift shown in A. Wild-type littermate EDL and soleus muscles have an FI of 0.17±0.03 and 0.44±0.07, respectively. In SOD1G93Adl B6 mice at 34 weeks, both muscles are more fatigue resistant than that of wild-type littermates, and EDL has an FI of 0.37±0.05 (P=0.007) and soleus an FI of 0.62±0.02 (not significant; P=0.08). *P<0.05.
Fig. 6.
Fig. 6.
Glial reactions and the presence of misfolded SOD1 in SOD1G93Adl B6 spinal cord. Lumbar spinal cord sections from wild-type and SOD1G93Adl B6 mice at 22, 24 and 34 weeks were stained for markers that indicate pathology, such as GFAP (astrogliosis; top row, red), IBA1 (microglia; middle row, red) and using the SEDI antibody (DAB staining; bottom row). Wild-type spinal cord sections showed weak but specific immunoreactivity for both GFAP and IBA1; immunoreactivity for these markers was much stronger in SOD1G93Adl spinal cord even as early as 22 weeks of age, indicating the presence of glial activation. Misfolding of mutant SOD1 protein is also clearly detectable at 24 weeks using the SEDI antibody. Green staining in the top and middle row shows the localisation of neuronal cells (β-tubulin stain). Scale bars: 100 μm.
Fig. 7.
Fig. 7.
Electron microscopy analysis of SOD1G93Adl B6 spinal cord. Immunogold labelling TEM with anti-SOD1 (A-E) and anti-TDP43 (F) of wild-type littermate and SOD1G93Adl B6 spinal cord lumbar regions. (A) An axonal profile of a wild-type littermate control mouse, showing the typically low levels of anti-SOD1 labelling. (B) An axonal profile of a SOD1G93Adl B6 mouse showing the typically heavier levels of anti-SOD1 labelling. (C) An axonal profile of a SOD1G93Adl B6 mouse containing very dense aggregates that are heavily labelled for SOD1. (D) A cytoplasmic SOD1-positive inclusion with a fibrillar appearance in a SOD1G93Adl B6 mouse. (E,F) Serial sections of a SOD1G93Adl B6 spinal cord single-labelled for SOD1 (E) and TDP43 (F), showing the same inclusion that is both SOD1 positive and TDP43 negative. Scale bars: 0.2 μm (A,D); 0.5 μm (B,C,E,F).

References

    1. Achilli F., Boyle S., Kieran D., Chia R., Hafezparast M., Martin J. E., Schiavo G., Greensmith L., Bickmore W., Fisher E. M. (2005). The SOD1 transgene in the G93A mouse model of amyotrophic lateral sclerosis lies on distal mouse chromosome 12. Amyotroph. Lateral Scler. Other Motor Neuron Disord. 6, 111–114 - PubMed
    1. Alexander G. M., Erwin K. L., Byers N., Deitch J. S., Augelli B. J., Blankenhorn E. P., Heiman-Patterson T. D. (2004). Effect of transgene copy number on survival in the G93A SOD1 transgenic mouse model of ALS. Brain Res. Mol. Brain Res. 130, 7–15 - PubMed
    1. Avraham K. B., Schickler M., Sapoznikov D., Yarom R., Groner Y. (1988). Down’s syndrome: abnormal neuromuscular junction in tongue of transgenic mice with elevated levels of human Cu/Zn-superoxide dismutase. Cell 54, 823–829 - PubMed
    1. Benatar M. (2007). Lost in translation: treatment trials in the SOD1 mouse and in human ALS. Neurobiol. Dis. 26, 1–13 - PubMed
    1. Birve A., Neuwirth C., Weber M., Marklund S. L., Nilsson A. C., Jonsson P. A., Andersen P. M. (2010). A novel SOD1 splice site mutation associated with familial ALS revealed by SOD activity analysis. Hum. Mol. Genet. 19, 4201–4206 - PubMed

Publication types

MeSH terms