

Coronary revascularization trends in the United States, 2001-2008
- PMID: 21540420
- PMCID: PMC3164857
- DOI: 10.1001/jama.2011.551
Coronary revascularization trends in the United States, 2001-2008
Abstract
Context: Coronary revascularization is among the most common hospital-based major interventional procedures performed in the United States. It is uncertain how new revascularization technologies, new clinical evidence from trials, and updated clinical guidelines have influenced the volume and distribution of coronary revascularizations over the past decade.
Objective: To examine national time trends in the rates and types of coronary revascularizations.
Design, setting, and patients: A serial cross-sectional study with time trends of patients undergoing coronary artery bypass graft (CABG) surgery or percutaneous coronary interventions (PCIs) between 2001 and 2008 at US hospitals in the Healthcare Cost and Utilization Project's Nationwide Inpatient Sample, which reports inpatient coronary revascularizations. These data were supplemented by Medicare outpatient hospital claims.
Main outcome measures: Annual procedure rates of coronary revascularizations, CABG surgery, and PCI.
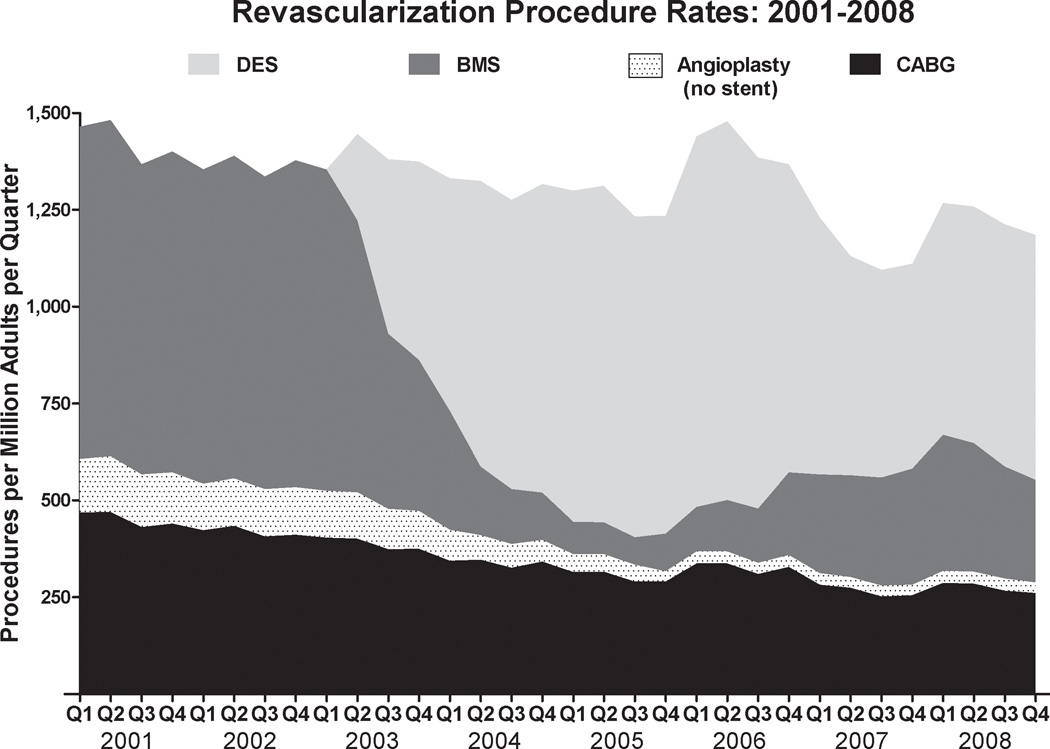
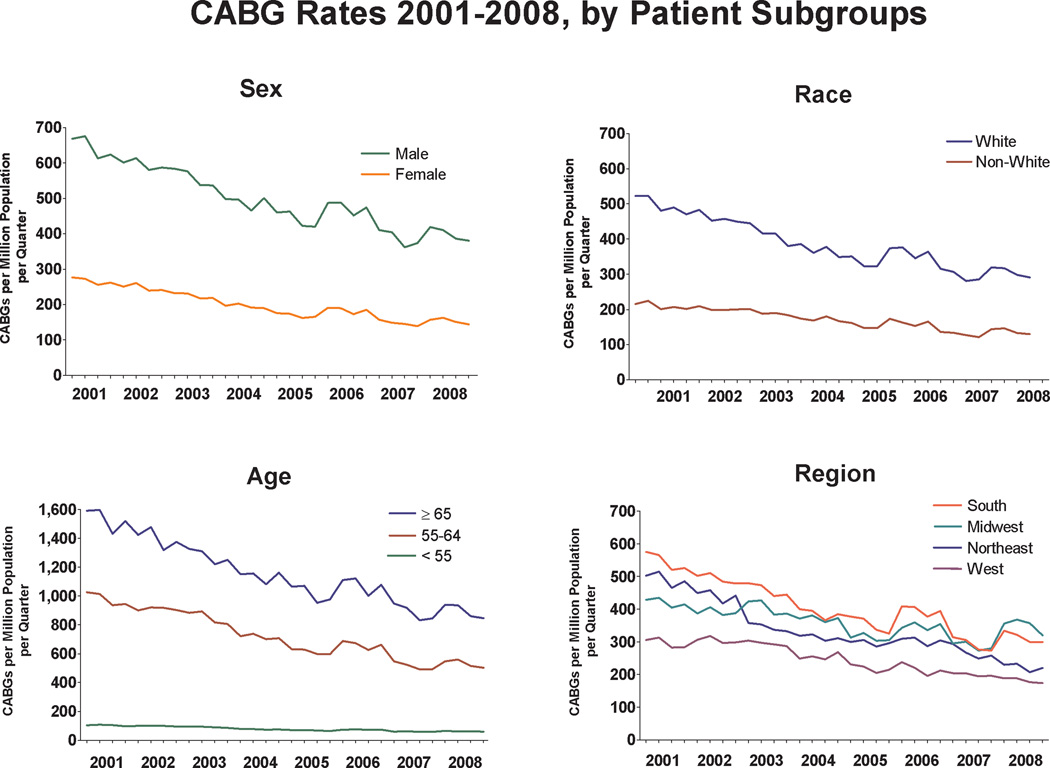
Results: A 15% decrease (P < .001) in the annual rate of coronary revascularizations was observed from 2001-2002 to 2007-2008. The annual CABG surgery rate decreased steadily from 1742 (95% confidence interval [CI], 1663-1825) CABG surgeries per million adults per year in 2001-2002 to 1081 (95% CI, 1032-1133) CABG surgeries per million adults per year in 2007-2008 (P < .001), but PCI rates did not significantly change (3827 [95% CI, 3578-4092] PCI per million adults per year in 2001-2002 vs 3667 [95% CI, 3429-3922] PCI per million adults per year in 2007-2008, P = .74). Between 2001 and 2008, the number of hospitals in the Nationwide Inpatient Sample providing CABG surgery increased by 12% (212 in 2001 vs 241 in 2008, P = .03), and the number of PCI hospitals increased by 26% (246 in 2001 vs 331 in 2008, P < .001). The median CABG surgery caseload per hospital decreased by 28% (median [interquartile range], 253 [161-458] in 2001 vs 183 [98-292] in 2008; P < .001) and the number of CABG surgery hospitals providing fewer than 100 CABG surgeries per year increased from 23 (11%) in 2001 to 62 (26%) in 2008 (P < .001).
Conclusions: In US hospitals between 2001 and 2008, a substantial decrease in CABG surgery utilization rates was observed, but PCI utilization rates remained unchanged.
Conflict of interest statement
None of the authors had any personal or financial conflicts of interest in regard to this study.
Figures
References
-
- DeFrances CJ, Lucas CA, Vuie VC, Golosinskiy A. 2006 National Hospital Discharge Survey. Hyattsville, MD: National Center for Health Statistics; 2008. - PubMed
-
- Centers for Medicare and Medicaid Services; [Accessed February 24, 2010]. Inpatient Hospital Payment Information for Value-Driven Health Care. Available at: http://www.cms.hhs.gov/HealthCareConInit/02_Hospital.asp.
-
- Roe MT, Chen AY, Cannon CP, et al. Temporal changes in the use of drug-eluting stents for patients with non-ST-Segment-elevation myocardial infarction undergoing percutaneous coronary intervention from 2006 to 2008: results from the can rapid risk stratification of unstable angina patients suppress ADverse outcomes with early implementation of the ACC/AHA guidelines (CRUSADE) and acute coronary treatment and intervention outcomes network-get with the guidelines (ACTION-GWTG) registries. Circ Cardiovasc Qual Outcomes. 2009;2(5):414–420. - PubMed
-
- Hernandez AF, Li S, Dokholyan RS, O'Brien SM, Ferguson TB, Peterson ED. Variation in perioperative vasoactive therapy in cardiovascular surgical care: data from the Society of Thoracic Surgeons. Am Heart J. 2009;158(1):47–52. - PubMed
-
- Li Z, Yeo KK, Parker JP, Mahendra G, Young JN, Amsterdam EA. Off-pump coronary artery bypass graft surgery in California, 2003 to 2005. Am Heart J. 2008;156(6):1095–1102. - PubMed
Publication types
MeSH terms
Grants and funding
LinkOut - more resources
Full Text Sources
Other Literature Sources
Medical
Miscellaneous
