. 2011 May;121(5):1917-29.
doi: 10.1172/JCI43615. Epub 2011 Apr 11.

Dual elimination of the glucagon and GLP-1 receptors in mice reveals plasticity in the incretin axis

Affiliations

Dual elimination of the glucagon and GLP-1 receptors in mice reveals plasticity in the incretin axis

Safina Ali et al. J Clin Invest. 2011 May.

Abstract

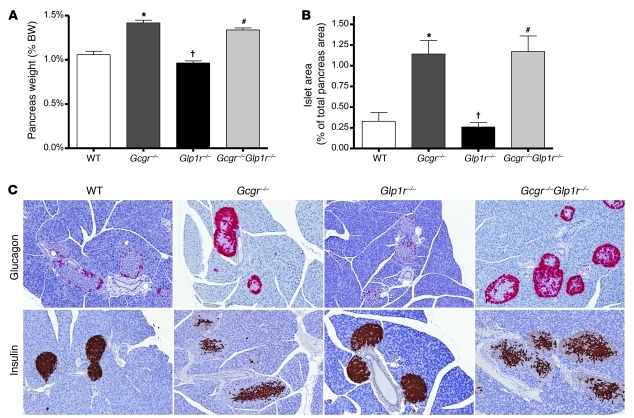
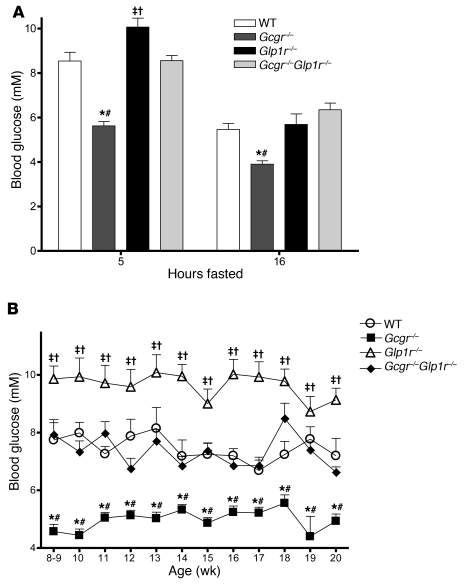
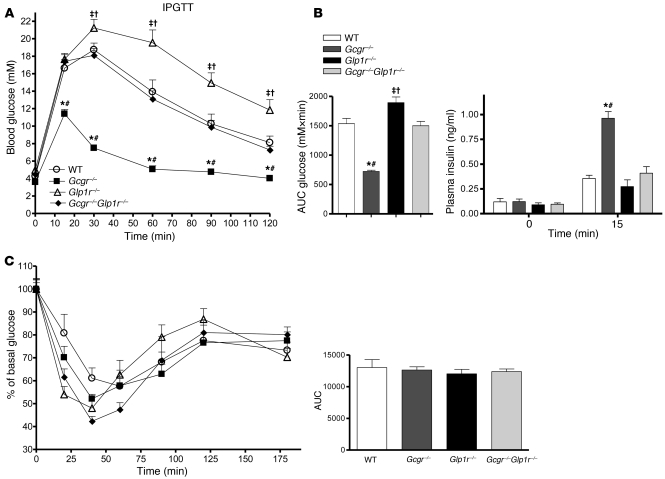
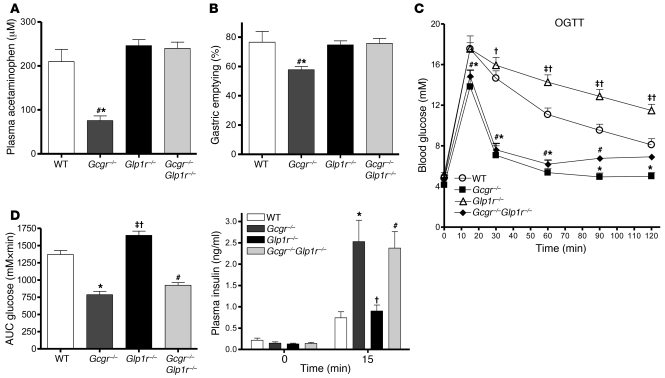
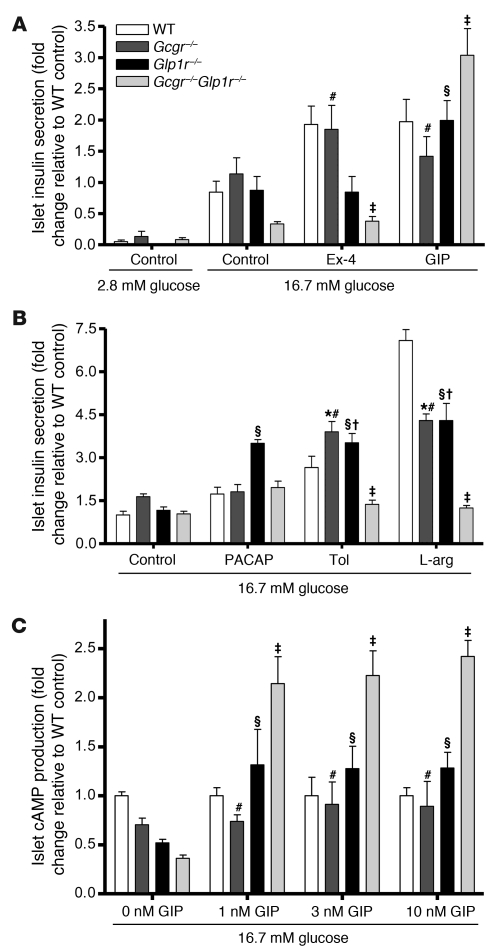
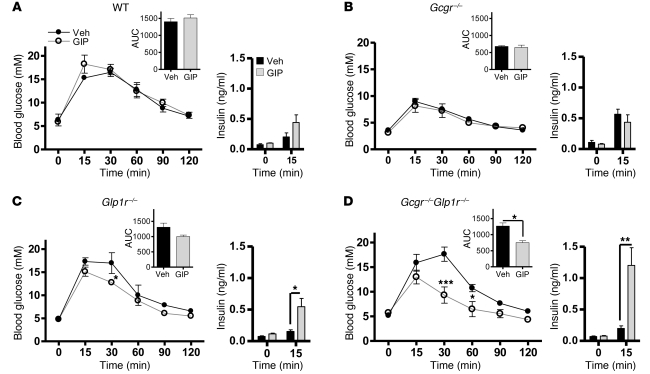
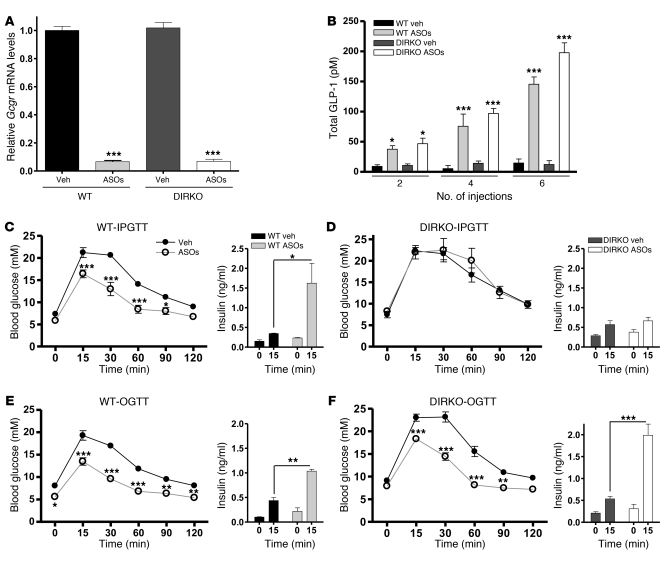
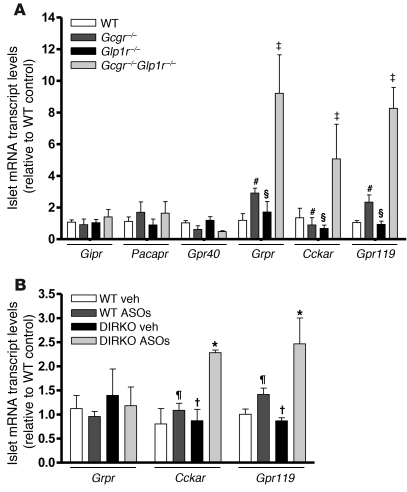
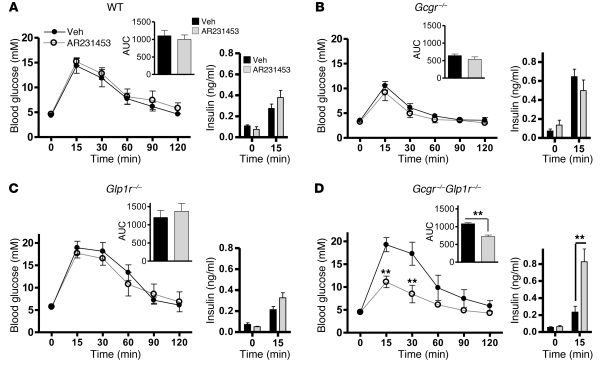
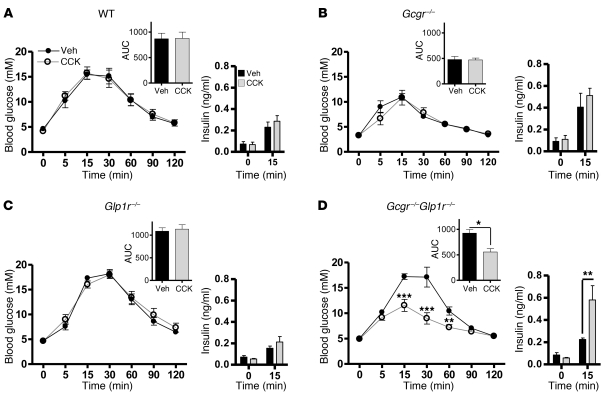
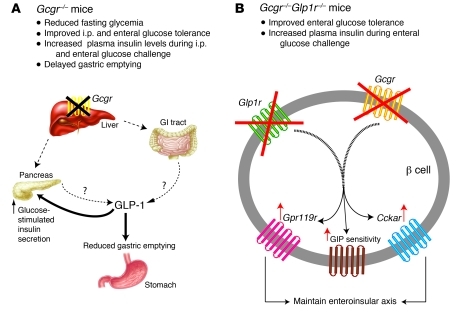
Disordered glucagon secretion contributes to the symptoms of diabetes, and reduced glucagon action is known to improve glucose homeostasis. In mice, genetic deletion of the glucagon receptor (Gcgr) results in increased levels of the insulinotropic hormone glucagon-like peptide 1 (GLP-1), which may contribute to the alterations in glucose homeostasis observed in Gcgr-/- mice. Here, we assessed the contribution of GLP-1 receptor (GLP-1R) signaling to the phenotype of Gcgr-/- mice by generating Gcgr-/-Glp1r-/- mice. Although insulin sensitivity was similar in all genotypes, fasting glucose was increased in Gcgr-/-Glp1r-/- mice. Elimination of the Glp1r normalized gastric emptying and impaired intraperitoneal glucose tolerance in Gcgr-/- mice. Unexpectedly, deletion of Glp1r in Gcgr-/- mice did not alter the improved oral glucose tolerance and increased insulin secretion characteristic of that genotype. Although Gcgr-/-Glp1r-/- islets exhibited increased sensitivity to the incretin glucose-dependent insulinotropic polypeptide (GIP), mice lacking both Glp1r and the GIP receptor (Gipr) maintained preservation of the enteroinsular axis following reduction of Gcgr signaling. Moreover, Gcgr-/-Glp1r-/- islets expressed increased levels of the cholecystokinin A receptor (Cckar) and G protein-coupled receptor 119 (Gpr119) mRNA transcripts, and Gcgr-/-Glp1r-/- mice exhibited increased sensitivity to exogenous CCK and the GPR119 agonist AR231453. Our data reveal extensive functional plasticity in the enteroinsular axis via induction of compensatory mechanisms that control nutrient-dependent regulation of insulin secretion.


Figures

Figure 1
Figure 1. Glp1r is not required for development of increased pancreas weight or α cell hyperplasia in Gcgr–/– mice.
(A) Pancreas weight of 20- to 24-week-old mice shown as percentage of the final body weight (n = 7–20 mice per group). (B) Islet area shown as a percentage of total pancreas area (n = 4–12 mice per group) (C) Representative histological sections of pancreas stained for insulin or glucagon alone. Final magnification, ×80. Values are expressed as mean ± SEM. *P < 0.05, Gcgr–/– mice versus WT littermate controls; #P < 0.05, Gcgr–/–Glp1r–/– mice versus WT littermate control mice; P < 0.05, Glp1r–/– versus Gcgr–/–Glp1r–/– mice.
Figure 2
Figure 2. Glp1r controls fasting and fed glycemia in Gcgr–/– mice.
(A) Blood glucose following 5 or 16 hours of fasting in 8- to 12-week-old WT, Gcgr–/–, Glp1r–/–, and Gcgr–/–Glp1r–/– mice (n = 5–30 mice per genotype). (B) Weekly random-fed blood glucose levels in 8- to 20-week-old Gcgr–/–Glp1r–/–, Gcgr–/–, Glp1r–/–, and littermate control WT mice (n = 3–20 mice per group). Values are expressed as mean ± SEM. *P < 0.05, Gcgr–/– versus Gcgr–/–Glp1r–/– mice; #P < 0.05, Gcgr–/– versus WT mice; P < 0.05, Glp1r–/– versus WT mice; P < 0.05, Glp1r–/– versus Gcgr–/–Glp1r–/– mice.
Figure 3
Figure 3. Loss of Glp1r reverses improvements in i.p. glucose tolerance without altering insulin sensitivity in Gcgr–/– mice.
(A) IPGTT in 8- to 10-week-old WT, Gcgr–/–, Glp1r–/–, and Gcgr–/–Glp1r–/– mice (n = 9–24 mice per group). (B) Area under the curve and plasma insulin levels at 0 and 15 minutes following i.p. glucose challenge (n = 4–8 mice per group). (C) Insulin tolerance test in 12- to 14-week-old mice; values are normalized to basal glucose, with right graph showing area under the glucose curve (n = 5–20 mice per group). Values are expressed as mean ± SEM. *P < 0.05, Gcgr–/– versus Gcgr–/–Glp1r–/– mice; #P < 0.05, Gcgr–/– versus WT mice; P < 0.05, Glp1r–/– versus WT mice; P < 0.05, Glp1r–/– versus Gcgr–/–Glp1r–/– mice.
Figure 4
Figure 4. Glp1r mediates reduced gastric emptying but not improved oral glucose tolerance in Gcgr–/– mice.
(A) Liquid-phase gastric emptying (as determined by the appearance of acetaminophen in the circulation after 15 minutes) in 10- to 11-week-old mice (n = 4–14 mice per group). (B) Solid-phase gastric emptying in 20-week-old mice (n = 4–10 mice per group). Values are expressed as mean ± SEM. *P < 0.05, Gcgr–/– versus Gcgr–/–Glp1r–/– mice; #P < 0.05, Gcgr–/– versus WT mice. (C) Blood glucose levels during an OGTT in 10- to 11-week-old mice (n = 11–22 mice per group). (D) Area under the glucose curve and plasma insulin levels 0 and 15 minutes following oral glucose challenge (n = 4–9 mice per group). Values are expressed as mean ± SEM. In C and D: *P < 0.05, Gcgr–/– versus WT littermate control mice; #P < 0.05, Gcgr–/–Glp1r–/– versus WT mice; P < 0.05, Glp1r–/– versus Gcgr–/–Glp1r–/– littermate control mice; P < 0.05, Glp1r–/– versus WT littermate control mice.
Figure 5
Figure 5. Function of GPCRs in isolated islets.
Islet insulin secretion was assessed by preincubation of islets in KRB for 60 minutes at 2.8 mM glucose at 37°C before distribution in batches of 10 islets per condition into wells containing 16.7 mM glucose with or without (A) exendin-4 (Ex-4, 10 nM), [d-Ala2]GIP (GIP, 10 nM), (B) PACAP (10 nM), tolbutamide (Tol, 100 μM), or l-arginine (L-arg, 10 mM) for 1 hour at 37°C. Levels of insulin in the secretion medium were normalized to levels of islet insulin content and are expressed as a fold change in insulin secretion relative to WT high-glucose treatment. Insulin content values averaged approximately 30–40 ng/islet for Glp1r–/– and WT mice and 15–25 ng/islet for Gcgr–/– and Gcgr–/–Glp1r–/– mice (n = 3 mice per group). Data shown are representative of 2–3 independent experiments, each with 3 replicates per condition. (C) Total cellular and media cAMP in islets from WT, Glp1r–/–, Gcgr–/–, and Gcgr–/–Glp1r–/– mice was quantified following treatment of the islets with 0, 1, 3, or 10 nM [d-Ala2]GIP. Levels of cAMP in the secretion medium were normalized to levels of islet insulin content and are expressed as a fold change in islet cAMP levels relative to WT high-glucose treatment (n = 3 mice per group). Values are expressed as mean ± SEM. §P < 0.05, Glp1r–/– versus Gcgr–/–Glp1r–/– mice; #P < 0.05, Gcgr–/– versus Gcgr–/–Glp1r–/– mice; P < 0.05, Gcgr–/–Glp1r–/– versus WT mice; P < 0.05, Glp1r–/– versus WT mice; *P < 0.05, Gcgr–/– versus WT mice.
Figure 6
Figure 6. Gcgr–/–Glp1r–/– mice exhibit enhanced sensitivity to [d-Ala2]GIP.
An IPGTT was performed in 20- to 22-week-old (A) WT, (B) Gcgr–/–, (C) Glp1r–/–, and (D) Gcgr–/–Glp1r–/– mice following treatment with 1 nmol/kg [d-Ala2]GIP or saline (vehicle [Veh]). Insets depict the area under the glucose excursion curve (AUC) in mM×min and plasma insulin levels at 0 and 15 minutes following glucose challenge (n = 5–8). Values are expressed as mean ± SEM. *P < 0.05, **P < 0.01, ***P < 0.001, [d-Ala2]GIP–treated versus saline-treated group.
Figure 7
Figure 7. Enteroinsular axis is maintained in DIRKO mice treated with Gcgr ASOs.
(A) mRNA expression of Gcgr in the liver (n = 3 per group) following treatment with 6 injections of 25 mg/kg Gcgr ASOs. (B) Total plasma GLP-1 levels following 2, 4, or 6 injections of 25 mg/kg saline or Gcgr ASOs (n = 5 per group). (C and D) An i.p. glucose challenge was performed on 13- to 14-week-old male (C) WT mice and (D) DIRKO mice that had been treated with 3 injections of vehicle or 25 mg/kg Gcgr ASOs (n = 5 per group). (E and F) An OGTT was performed on 15- to 16-week-old (E) WT mice and (F) DIRKO mice that had been treated with 4 injections of vehicle or 25 mg/kg Gcgr ASOs (n = 5 per group). Insets depict plasma insulin levels at 0 and 15 minutes following glucose challenge for saline- or Gcgr ASO–treated mice (n = 5 per treatment group). Values are expressed as mean ± SEM. *P < 0.05, **P < 0.01, ***P < 0.001, vehicle- versus Gcgr ASO–treated WT or DIRKO mice.
Figure 8
Figure 8. Expression of insulinotropic GPCRs in islets.
(A) Islets were isolated from WT, Gcgr–/–, Glp1r–/–, and Gcgr–/–Glp1r–/– mice, followed by isolation of mRNA for real-time PCR of basal levels of transcripts encoding Gipr, Pacapr, Gpr40, Grpr, Cckar, and Gpr119. (B) Islets were isolated from WT or DIRKO mice following 6 injections of vehicle or 25 mg/kg Gcgr ASOs, and mRNA levels of Grpr, Gpr119, and Cckar were determined. Levels of transcripts were normalized to levels of cyclophilin for each RNA sample. n = 4 mice per genotype. Values are expressed as mean ± SEM. §P < 0.05, Glp1r–/– versus Gcgr–/–Glp1r–/– mice; #P < 0.05, Gcgr–/– versus Gcgr–/–Glp1r–/– mice; P < 0.05, Gcgr–/–Glp1r–/– versus WT mice; P < 0.01, WT Gcgr ASO– vs DIRKO Gcgr ASO–treated mice; *P < 0.01, WT saline- versus DIRKO Gcgr ASO–treated mice; P < 0.01, DIRKO saline- versus DIRKO Gcgr ASO–treated mice.
Figure 9
Figure 9. Gcgr–/–Glp1r–/– mice exhibit enhanced sensitivity to the GPR119 agonist AR231453.
An IPGTT was performed in 22- to 24-week-old (A) WT (B), Gcgr–/– (C), Glp1r–/–, and (D) Gcgr–/–Glp1r–/– mice 30 minutes following treatment with 5 mg/kg AR231453 or vehicle. Insets depict the area under the glucose excursion curve in mM.min and plasma insulin levels at 0 and 15 minutes following glucose challenge (n = 5–8). Values are expressed as mean ± SEM. **P < 0.01, AR231453- versus vehicle-treated mice.
Figure 10
Figure 10. Gcgr–/–Glp1r–/– mice exhibit increased sensitivity to CCK.
An IPGTT was performed in 22- to 24-week-old (A) WT, (B) Gcgr–/–, (C) Glp1r–/–, and (D) Gcgr–/–Glp1r–/– mice following treatment with 9 μg/kg of CCK-8 or vehicle. Insets depict the area under the glucose excursion curve (AUC) in mM.min and plasma insulin levels at 0 and 15 minutes following glucose challenge (n = 5–8). Values are expressed as mean ± SEM. *P < 0.05, **P < 0.01, ***P <0.001, CCK-8– versus saline-treated mice.
Figure 11
Figure 11. Schematic of proposed model.
(A) Loss of Gcgr in the liver markedly elevates plasma GLP-1 levels, which promotes glucose-stimulated insulin secretion during i.p. glucose challenge and inhibits gastric emptying in Gcgr–/– mice. (B) Loss of Glp1r in the Gcgr–/– mice results in preservation of the enteroinsular axis via compensatory mechanisms such as upregulation of Gpr119 and Cckar action in β cells, independent of the increase in GIP sensitivity.

References

    1. Cryer PE. Hypoglycaemia: the limiting factor in the glycaemic management of Type I and Type II diabetes. Diabetologia. 2002;45(7):937–948. doi: 10.1007/s00125-002-0822-9. - DOI - PubMed
    1. Jaspan JB, Rubinstein AH. Circulating glucagon: plasma profiles and metabolism in health and disease. Diabetes. 1977;26(9):887–902. - PubMed
    1. Unger RH, Aguilar-Parada E, Muller WA, Eisentraut AM. Studies of pancreatic alpha cell function in normal and diabetic subjects. J Clin Invest. 1970;49(4):837–848. doi: 10.1172/JCI106297. - DOI - PMC - PubMed
    1. Sherwin RS, Fisher M, Hendler R, Felig P. Hyperglucagonemia and blood glucose regulation in normal, obese and diabetic subjects. N Engl J Med. 1976;294(9):455–461. - PubMed
    1. Unger RH. Glucagon physiology and pathophysiology in the light of new advances. Diabetologia. 1985;28(8):574–578. - PubMed

Publication types