. 2011:2011:474632.
doi: 10.1155/2011/474632. Epub 2011 Mar 31.

MicroRNA gene dosage alterations and drug response in lung cancer

Affiliations

MicroRNA gene dosage alterations and drug response in lung cancer

Katey S S Enfield et al. J Biomed Biotechnol. 2011.

Abstract

Chemotherapy resistance is a key contributor to the dismal prognoses for lung cancer patients. While the majority of studies have focused on sequence mutations and expression changes in protein-coding genes, recent reports have suggested that microRNA (miRNA) expression changes also play an influential role in chemotherapy response. However, the role of genetic alterations at miRNA loci in the context of chemotherapy response has yet to be investigated. In this study, we demonstrate the application of an integrative, multidimensional approach in order to identify miRNAs that are associated with chemotherapeutic resistance and sensitivity utilizing publicly available drug response, miRNA loci copy number, miRNA expression, and mRNA expression data from independent resources. By instigating a logical stepwise strategy, we have identified specific miRNAs that are associated with resistance to several chemotherapeutic agents and provide a proof of principle demonstration of how these various databases may be exploited to derive relevant pharmacogenomic results.


Figures
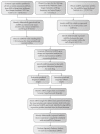
Figure 1
Figure 1
The search for drug response-related miRNAs began with data acquisition from several independent databases. Drug response data for lung cancer cell lines (LCCLs) was integrated independently with copy number and expression data, and unique filtering criteria were applied. The integration of all three dimensions applied further filtration criteria, and the remaining miRNAs underwent predicted target analysis. The resulting mRNA target expression was anticorrelated with miRNA expression, and cellular functions of the final mRNA target list were derived by Ingenuity Pathway Analysis.
Figure 2
Figure 2
Flowchart summarizing the process for the identification of the four miRNAs which correlated significantly with drug response.
Figure 3
Figure 3
Comparison of the frequency of alteration of 636 miRNA loci between highly sensitive and highly resistant lung cancer cell lines (LCCLs) to agent TAE684. Highly sensitive LCCLs were represented by the lowest tertile of IC50 while the highly resistant were represented by the highest tertile of IC50. miRNA genomic position information was obtained from the UCSC Genome Browser database [37], and miRNAs on chromosomes X and Y were excluded. Copy number alterations frequencies were plotted using SIGMA2 software [36]. Vertical lines denote the frequency of alteration, where 1 or −1 signifies the alteration that occurs in 100% of samples. Horizontal bars depict miRNAs, with the frequency of copy gains and losses of each miRNA displayed to the right and left of 0, respectively. miRNAs disrupted in resistant lines are displayed in red, those occurring in sensitive lines are displayed in green, and regions of overlapping frequencies are shown in black.
Figure 4
Figure 4
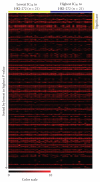
Heatmap visualization of the miRNA expression of the 254 miRNAs (represented by 292 unique probes) that passed expression filtering criteria for the 21 most sensitive (yellow bar, low IC50) and 21 most resistant (blue bar, high IC50) to drug HKI-272. In total, 30 miRNAs were found to be significantly differentially expressed between the most sensitive and resistant lung cancer cell lines (LCCLs, orange bar). For this visualization, since a value of 4 represented no expression, all expression values were subtracted by 4 such that baseline expression would be shown as 0 (black).
Figure 5
Figure 5
Example of a miRNA showing differentially copy number alteration, differential miRNA expression, and differential target gene expression. (a) Copy number alteration comparison between cell lines which are highly resistant and sensitive to agent MG-132 revealed that the hsa-miR-10b locus, on chromosomal region 2q31.1, is more frequently gained in the highly resistant cell lines (P < .05, Fisher's exact test). (b) miRNA expression analysis of miR-10b shows that expression is significantly higher in highly resistant cell lines as compared to sensitive cell lines to MG-132 (P = .03, Mann Whitney U test). (c) mRNA expression analysis of RAD1, a gene identified by bioinformatics prediction analysis as a putative target of miR-10b, shows anticorrelative expression to miR-10b expression. Specifically, decreased expression of RAD1 in highly resistant cell lines to MG-132 relative to highly sensitive lines is observed.
Figure 6
Figure 6
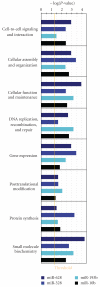
Overrepresented cellular and molecular functions that are common to all four sets of differentially expressed target genes. A “Core Analysis Comparison” was performed using Ingenuity Pathway Analysis and within the Biological Functions, only functions within Molecular and Cellular Functions were assessed. In total, eight of these functions were significant in all four sets. The orange threshold line corresponds to a P-value of  .05.

Similar articles

Cited by

References

    1. Jemal A, Siegel R, Xu J, Ward E. Cancer statistics, 2010. CA: Cancer Journal for Clinicians. 2010;60(5):277–300. - PubMed
    1. Wakelee H, Belani CP. Optimizing first-line treatment options for patients with advanced NSCLC. Oncologist. 2005;10(3):1–10. - PubMed
    1. Scagliotti G, Hanna N, Fossella F, et al. The differential efficacy of pemetrexed according to NSCLC histology: a review of two phase III studies. Oncologist. 2009;14(3):253–263. - PubMed
    1. Fukuoka M, Yano S, Giaccone G, et al. Multi-institutional randomized phase II trial of gefitinib for previously treated patients with advanced non-small-cell lung cancer. Journal of Clinical Oncology. 2003;21(12):2237–2246. - PubMed
    1. Mok TS, Wu YL, Thongprasert S, et al. Gefitinib or carboplatin-paclitaxel in pulmonary adenocarcinoma. The New England Journal of Medicine. 2009;361(10):947–957. - PubMed

Publication types