. 2011 Apr 26;6(4):e18146.
doi: 10.1371/journal.pone.0018146.

Glucose and fatty acids synergize to promote B-cell apoptosis through activation of glycogen synthase kinase 3β independent of JNK activation

Affiliations

Glucose and fatty acids synergize to promote B-cell apoptosis through activation of glycogen synthase kinase 3β independent of JNK activation

Katsuya Tanabe et al. PLoS One. .

Abstract

Background: The combination of elevated glucose and free-fatty acids (FFA), prevalent in diabetes, has been suggested to be a major contributor to pancreatic β-cell death. This study examines the synergistic effects of glucose and FFA on β-cell apoptosis and the molecular mechanisms involved. Mouse insulinoma cells and primary islets were treated with palmitate at increasing glucose and effects on apoptosis, endoplasmic reticulum (ER) stress and insulin receptor substrate (IRS) signaling were examined.

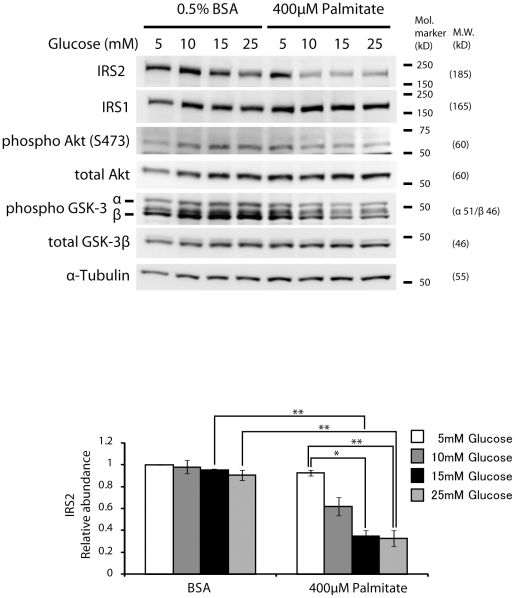
Principal findings: Increasing glucose (5-25 mM) with palmitate (400 µM) had synergistic effects on apoptosis. Jun NH2-terminal kinase (JNK) activation peaked at the lowest glucose concentration, in contrast to a progressive reduction in IRS2 protein and impairment of insulin receptor substrate signaling. A synergistic effect was observed on activation of ER stress markers, along with recruitment of SREBP1 to the nucleus. These findings were confirmed in primary islets. The above effects associated with an increase in glycogen synthase kinase 3β (Gsk3β) activity and were reversed along with apoptosis by an adenovirus expressing a kinase dead Gsk3β.

Conclusions/significance: Glucose in the presence of FFA results in synergistic effects on ER stress, impaired insulin receptor substrate signaling and Gsk3β activation. The data support the importance of controlling both hyperglycemia and hyperlipidemia in the management of Type 2 diabetes, and identify pancreatic islet β-cell Gsk3β as a potential therapeutic target.


Conflict of interest statement

Competing Interests: The authors have declared that no competing interests exist.

Figures

Figure 1
Figure 1. Synergistic effects of glucose and palmitate on cell death but not JNK activation in MIN6 cells.
MIN6 cells were treated with either control 0.5% BSA or 400 µM palmitate+0.5% BSA at a concentration of 5, 10, 15, 25 mM glucose for 24-h. (A) The percentage of cell death was then assessed by adding propidium iodide for the last hour of incubation as described under Methods. The bar graph depicts the averages of the data obtained from five individual experiments, and data are expressed as means ±S.E.M. ** p<0.01, *** p<0.001; (B) The cell lysates were subjected to Western blot analysis using anti-cleaved Caspase3, anti-phospho-JNK, anti-total JNK and anti-α-Tubulin antibodies. Protein level of phospho-JNK was normalized over total JNK. Cleaved Caspase3 levels were normalized over α-Tubulin. The representative result of three individual experiments is shown. The data obtained from three individual experiments are expressed as means ± S.E.M. * p<0.05, ** p<0.01.
Figure 2
Figure 2. Glucose and palmitate potentiate to reduce insulin signaling.
MIN6 cells were treated with either control 0.5% BSA (four lanes on left) or 400 µM palmitate+0.5% BSA (four lanes on right) at a concentration of 5, 10, 15, 25 mM glucose for 24-h. Total cell lysates were obtained and were subjected to Western blot analysis with antibodies to the indicated proteins. Protein level of IRS2 was normalized over α-Tubulin. The representative results of three individual experiments are shown. The results for IRS2 are graphically illustrated, data are expressed as means ±S.E.M. *p<0.05, **p<0.01.
Figure 3
Figure 3. The synergistic effects of glucose and palmitate on ER stress and reduction of insulin signaling is attenuated by addition of a chemical chaperon.
(A) MIN6 cells were treated with either control 0.5% BSA or 400 µM palmitate+0.5% BSA at a concentration of 5, 10, 25 mM glucose for 8 hours. Total cell lysates were extracted at indicated time points and were subjected to Western blot analysis using anti-phospho-PERK (980Thr), anti-phopsho-eIF2α (51Ser), and (B) MIN6 cells were treated with either control 0.5% BSA or 400 µM palmitate+0.5% BSA at a concentration of 5, 10, 25 mM glucose for 18 hours and blotted with anti-ATF3 and anti-CHOP antibodies. β-Actin was detected for loading control. Tunicamycin treatment was control for ER stress. (C) Cells were treated with either 500 µg/ml NaCl (ionic control) or 500 µg/ml TUDCA 15-h prior to beginning of palmitate treatment and then were co-treated with either 0.5% BSA or 400 µM palmitate+0.5% BSA with either 5 mM or 25 mM glucose and NaCl or TUDCA for 24 h. Total cell lysates were subjected to Western blot analysis with antibodies to the indicated proteins. Densitometry of total CHOP and cleaved Caspase3 and Pdx1 were measured and normalized over α-Tubulin, respectively. Densitometry of phospho-cJun was measured and normalized over total JNK. The representative results of three individual experiments are shown. The effects on CHOP, cleaved Caspase3 and phospho-cJun and Pdx1 protein are graphically illustrated. *p<0.05. (D) Cells were treated with either 500 µg/ml NaCl (ionic control) or 500 µg/ml TUDCA 15-h prior to beginning of palmitate treatment and then were co-treated with either 0.5% BSA or 400 µM palmitate+0.5% BSA with either 5 mM, 10 mM or 25 mM glucose and NaCl or TUDCA for 24-h. Total cell lysates were subjected to Western blot analysis with antibodies to the indicated proteins. Densitometry of total IRS2 was measured and normalized over α-Tubulin and densitometry of phospho-Akt was measured and normalized over total Akt. The representative results of three individual experiments are shown. The effects on IRS2 protein are graphically illustrated, *p<0.05, **p<0.01.
Figure 4
Figure 4. The synergistic effects of glucose and palmitate on ER stress results in concomitant effects on activation of SREBP1.
(A) MIN6 cells were treated with either control 0.5% BSA or 400 µM palmitate+0.5% BSA at a concentration of 5, 10, 15, 25 mM glucose for 18-h. Nuclear fractions were extracted from the cells and were subjected to Western blot analyses using anti-SREBP1 and anti-Lamin antibodies. 25 µg of nuclear protein was loaded in each lane. The upper band normalized over Lamin was used to do the quantification (the lower band is nonspecific). The relative ratio of nuclear SREBP1 over Lamin calculated by densitometries was summarized as means ± S.E.M. in the graph respectively. The representative results of three experiments are shown, and graphically illustrated, * p<0.05. (B) MIN6 cells were treated with either control 0.5% BSA or 400 µM palmitate+0.5% BSA at a concentration of either 5 or 25 mM glucose for 24-h. Total cell lysates were subjected to Western blot analysis using anti-acetyl CoA carboxylase (ACC) and anti-α-Tubulin antibodies. The representative results of two individual experiments are shown. (C) Cells were treated with either 500 µg/ml NaCl or 500 µg/ml TUDCA 15-h prior to beginning of palmitate treatment. Cells were co-treated with either 0.5% BSA or 400 µM palmitate+0.5% BSA with 25 mM glucose and NaCl or TUDCA for 18-h. Nuclear fractions were extracted from the cells and were subjected to Western blot analyses using anti-SREBP1 and anti-Lamin antibodies. The upper band normalized over Lamin was used to do the quantification (the lower band is nonspecific). 25 µg of nuclear extracts were loaded in each lane. The representative results of three individual experiments are shown. The relative ratio of nuclear SREBP1 over Lamin calculated by densitometries was summarized as means ± S.E.M. in the graph respectively **p<0.01.
Figure 5
Figure 5. Synergistic effects of glucose and palmitate on ER stress and suppression of IRS2 expression levels in primary mouse islets.
Islets from 14 weeks of age C57BL/6 male mice were isolated as described in Methods and were treated with either control 0.5% BSA or 400 µM palmitate+0.5% BSA in RPMI medium containing either 11 mM or 30 mM glucose, 10% FBS for 72-h. Total cell lysates were extracted from the islets and subjected to Western blot analysis using (A) anti-cleaved Caspase3 and anti-β-Actin, (B) anti-IRS2 antibodies, (C) anti-phospho-JNK, anti-total JNK, anti-GRP78, anti-CHOP, anti-α-Tubulin antibodies, (D) anti-ATF3 antibodies, (E) anti-Acetyl CoA Carboxylase (ACC), anti-SREBP1, anti-α-Tubulin antibodies, (F) anti-Pdx1, anti-phospho-Gsk3β, anti-total Gsk3β, anti-phospho-Akt (S473), anti-phospho-cJun, anti-α-Tubulin antibodies. The blots shown are representative of 3 individual islet experiments. The relative ratio of indicated protein over β-Actin or α-Tubulin as a loading control calculated by densitometries was summarized as means ± S.E.M. in the graph respectively *p<0.05, **p<0.01.
Figure 6
Figure 6. Loss-of-function of ATF3 and gain-of function of IRS2 reduce the effects of glucose and palmitate on apoptosis.
(A) INS-r3 cells were infected with either control or ATF3 shRNA adenovirus 24-h prior to treatment with 400 µM palmitate+0.5% BSA and 25 mM glucose for the indicated times. Total cell lysates were obtained and subjected to Western blot analysis with antibodies to the indicated proteins. The relative ratio of IRS2 and cleaved Caspase3 expression over β-Actin was quantified by densitometry. The data obtained from three individual experiments are expressed as means ± S.E.M. * p<0.02, ** p<0.012. (B) In a single experiment, primary mouse islets were infected with adenovirus expressing βgal or IRS2 expressing adenovirus prior to treatment with either control 0.5% BSA and 5.5 mM glucose or 400 µM palmitate+0.5% BSA and 25 mM glucose for 72-h. “GL” refers to incubation in 25 mM glucose and 400 µM palmitate. Total cell lysates were subjected to Western blot using antibodies to indicated proteins.
Figure 7
Figure 7. Inhibition of Gsk3β protects against glucose and palmitate-induced apoptosis in MIN6 cells.
MIN6 cells were infected with 100, 200, or 400 MOI of adenovirus expressing a catalytically inactive mutant of the human Gsk3β (Adv-Gsk3βKM) or adenovirus expressing GFP (Adv-GFP) 24 hours prior to palmitate treatment. Cells were treated with 25 mM glucose and with either 0.5% BSA or 400 µM PA+0.5% BSA for 24 hours. A GFP control was placed on either end of the blot to facilitate comparison of control and Adv-Gsk3βKM. (A) Western blots using the indicated antibodies, with relative expression of Pdx1 normalized over α-Tubulin, and expression levels of cleaved Caspase3 normalized over α-tubulin. (B) Percentage of Propidium Iodide incorporation (n = 3, means ± S.E.M., *p<0.05, *** p<0.001).
Figure 8
Figure 8. Working diagram illustrating some of the key steps involved in “glucolipotoxicity” of β-cells.
High glucose and FFA together result in a vicious negative cycle that ultimately promotes β-cell death. As suggested by our findings, high glucose addition to FFA treated β-cells results in much more activation of SREBP1 than glucose alone. SREBP1 enhances ACC expression with generation of malonyl-CoA which impairs FFA oxidation. This in turn leads to augmented ER stress with further activation of ER-localized SREBP1 as a result of degradation of the anchoring protein Insig1. The excess non-metabolized FFA due to more impairment of FFA oxidation would partition in ER membranes compounding ER stress. In addition to SREBP1, ER stress activates ATF3. Both nuclear SREBP1 and ATF3 result in inhibition of IRS2, with concomitant impairment of insulin signaling, activation of Gsk3β and reduction of Pdx1 leading to apoptosis.

Similar articles

Cited by

References

    1. Butler AE, Janson J, Bonner-Weir S, Ritzel R, Rizza RA, et al. Beta-cell deficit and increased beta-cell apoptosis in humans with type 2 diabetes. Diabetes. 2003;52:102–110. - PubMed
    1. Weir GC, Laybutt DR, Kaneto H, Bonner-Weir S, Sharma A. Beta-cell adaptation and decompensation during the progression of diabetes. Diabetes. 2001;50(Suppl 1):S154–159. - PubMed
    1. Unger RH. [Maurice Derot Prize 2001. The liporegulator system and disease]. Journ Annu Diabetol Hotel Dieu. 2001:129–143. - PubMed
    1. Donath MY, Halban PA. Decreased beta-cell mass in diabetes: significance, mechanisms and therapeutic implications. Diabetologia. 2004;47:581–589. - PubMed
    1. Zhou YP, Grill VE. Long-term exposure of rat pancreatic islets to fatty acids inhibits glucose-induced insulin secretion and biosynthesis through a glucose fatty acid cycle. J Clin Invest. 1994;93:870–876. - PMC - PubMed

Publication types

MeSH terms