. 2011 Apr 25;6(4):e18513.
doi: 10.1371/journal.pone.0018513.

α-synuclein reactive antibodies as diagnostic biomarkers in blood sera of Parkinson's disease patients

Affiliations

α-synuclein reactive antibodies as diagnostic biomarkers in blood sera of Parkinson's disease patients

Kiran Yanamandra et al. PLoS One. .

Abstract

Background: Auto-antibodies with specificity to self-antigens have been implicated in a wide variety of neurological diseases, including Parkinson's (PD) and Alzheimer's diseases, being sensitive indicators of neurodegeneration and focus for disease prevention. Of particular interest are the studies focused on the auto-immune responses to amyloidogenic proteins associated with diseases and their applications in therapeutic treatments such as vaccination with amyloid antigens and antibodies in PD, Alzheimer's disease and potentially other neurodegeneration ailments.

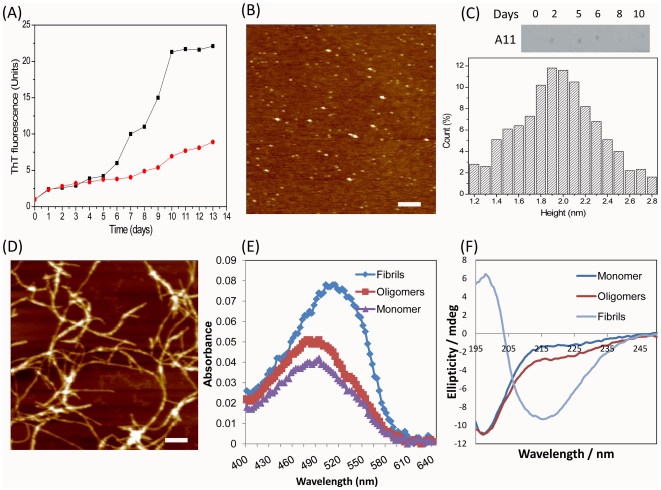
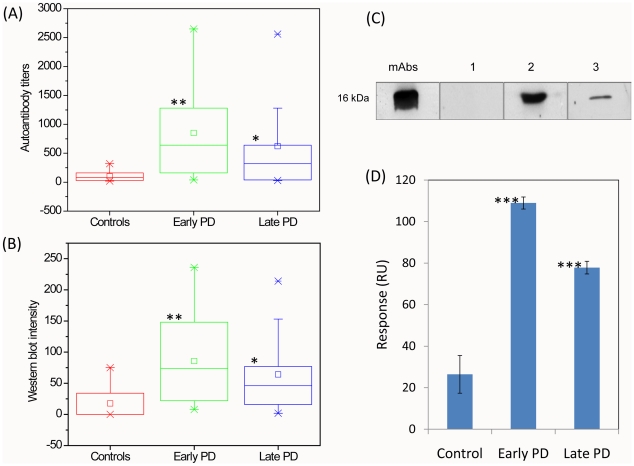
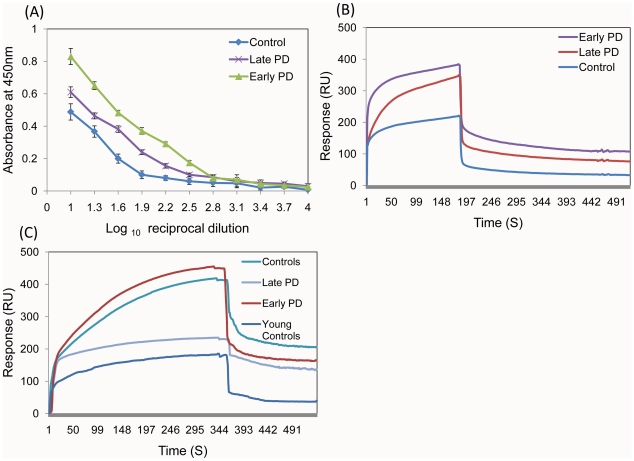
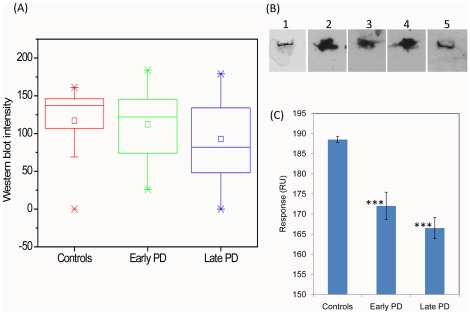
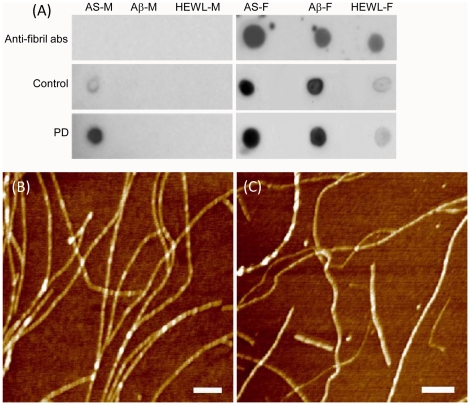
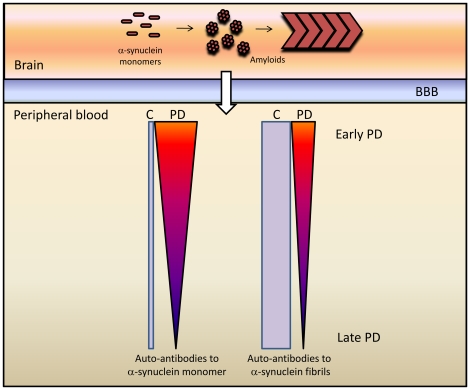
Methodology/principal findings: Generated auto-antibodies towards the major amyloidogenic protein involved in PD Lewy bodies--α-synuclein and its amyloid oligomers and fibrils were measured in the blood sera of early and late PD patients and controls by using ELISA, Western blot and Biacore surface plasmon resonance. We found significantly higher antibody levels towards monomeric α-synuclein in the blood sera of PD patients compared to controls, though the responses decreased with PD progression (P<0.0001). This indicates potential protective role of autoimmunity in maintaining the body homeostasis and clearing protein species whose disbalance may lead to amyloid assembly. There were no noticeable immune responses towards amyloid oligomers, but substantially increased levels of IgGs towards α-synuclein amyloid fibrils both in PD patients and controls, which subsided with the disease progression (P<0.0001). Pooled IgGs from PD patients and controls interacted also with the amyloid fibrils of Aβ (1-40) and hen lysozyme, however the latter were recognized with lower affinity. This suggests that IgGs bind to the generic amyloid conformational epitope, displaying higher specificity towards human amyloid species associated with neurodegeneration.

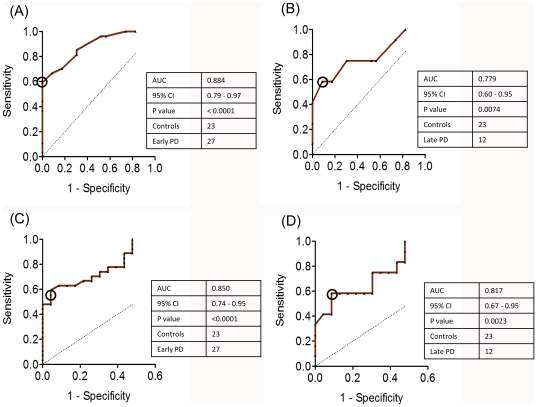
Conclusions/significance: Our findings may suggest the protective role of autoimmunity in PD and therefore immune reactions towards PD major amyloid protein--α-synuclein can be of value in the development of treatment and diagnostic strategies, especially during the early disease stages.


Conflict of interest statement

Competing Interests: The authors have declared that no competing interests exist.

Figures

Figure 1
Figure 1. Amyloid properties of α-synuclein.
(A) Kinetics of amyloid formation monitored by thoflavin T fluorescence at α-synuclein concentrations of 0.71 mM (black squares and line) and 0.21 mM (red circles and line). (B) AFM images of α-synuclein oligomers. (C) Top: dot blot analysis of interactions of anti-oligomeric A11 antibodies with the amyloid containing aliquots; days of amyloid incubation are indicated. Bottom: the distributions of the z-heights of α-synuclein oligomers measured by AFM cross-section analysis. (D) AFM images of α-synuclein fibrils. Scale bars in x,y-plain equal to 500 nm (B,D). (E) Congo red binding to α-synuclein monomeric, oligomeric and fibrillar species as denoted by corresponding color coding. (F) CD spectra of monomeric, oligomeric and fibrillar α-synuclein as denoted by corresponding color coding.
Figure 2
Figure 2. Immune responses towards α-synuclein monomer in the blood sera of controls, early and late PD patients.
Box-plots showing statistical distributions of immune responses to α-synuclein measured by ELISA (A) and Western blotting (B). The antibody titers (A) and Western blot band densities (B) are shown along y-axis and the groups subjected to analysis - along x-axis. Boxes include from 25% to 75% of all immune responses; central squares indicate the mean and line drawn crossed the box – the median values for each group; whiskers indicate the distribution from 5% to 95%, while small crosses correspond to remaining 10%. (C) Representative Western blots showing interactions with monomeric α-synuclein of monoclonal antibodies (mAbs) and sera IgGs from selected control (1), early PD (2) and late PD (3) individuals. (D) Biacore analysis of the interactions with α-synuclein of pooled IgGs from controls, early and late PD patients. Surface plasmon resonance responses in relative units are shown in y-axis. ***P<0.0001, **P<0.007 and *P<0.05.
Figure 3
Figure 3. Interaction of α-synuclein species with the sera antibodies of PD patients and controls.
ELISA titration curves corresponding to the interactions of monomeric α-synuclein with IgGs from the blood sera of representative control, early PD and late PD individuals as denoted in the caption (A). Biacore sensorgrams reflecting the biding of α-synuclein monomer (B) and fibrils (C) with IgGs from the pooled sera of control, young control (C), early PD and late PD individuals as denoted in the captions.
Figure 4
Figure 4. Assessment of diagnostic value of autoimmune responses to α-synuclein in PD patients.
Receiver operating characteristic (ROC) curves comparing the autoimmune responses towards α-synuclein between early PD (true positives) and controls (true negatives) determined by ELISA (A); between late PD and controls determined by ELISA (B); between early PD and controls determined by Western blot (C) and between late PD and controls determined by Western blot (D). The dotted line indicates the results when the parameter in question has no diagnostic value (AUC = 0.5). The optimum cutoff values (Youden index) are shown by the open circles. The tables summarize AUC, 95% confidence interval (CI), P value, number of controls and patients.
Figure 5
Figure 5. Immune responses towards amyloid fibrils of α-synuclein in the blood sera of controls, early and late PD patients.
(A) Box-plots showing statistical distributions of immune responses measured by Western blotting. The descriptions of box-plots are the same as in Figure 2B. (B) Representative native gel band corresponding to amyloid fibrils (1) and Western blots bands showing interactions of α-synuclein fibrils with anti-fibrillar antibodies (2), with sera IgGs from selected control (3) as well as early PD (4) and late PD (5) individuals. (C) Biacore analysis of the interactions with amyloid fibrils of pooled IgGs from the blood sera of controls, early and late PD patients. Surface plasmon resonance responses in relative units are shown in y-axis. ***P<0.0001.
Figure 6
Figure 6. Immune reactivity of pooled IgGs from the blood sera of controls and PD patients towards monomers and amyloid fibrils of different polypeptides measured by dot blot analysis.
(A) Dot blots demonstrating the immune reactivity towards monomers of α-synuclein (AS-M), Aβ peptide (Aβ-M) and hen egg white lysozyme (HEWL-M) are shown in the left panel and towards corresponding fibrils (AS-F, Aβ-F and HEWL-F) – in the right. The rows of dot blots from top to bottom show the interactions of antigens with added anti-fibrillar antibodies and pooled IgGs from the sera of controls and all PD patients, respectively. AFM images of amyloid fibrils of Aβ peptide (B) and hen egg white lysozyme (C) subjected to dot blot analysis. Scale bars in x,y-plain equal to 500 nm.
Figure 7
Figure 7. Schematic presentation of changes in the immune reactivity towards α-synuclein and its amyloids in the blood sera of PD patients and controls (C).
The thickness of the bars and gradients is proportional to immune responses.

Similar articles

Cited by

References

    1. Falk RH, Comenzo RL, Skinner M. The systemic amyloidoses. N Engl J Med. 1997;337:898–909. - PubMed
    1. Kahn SE, Andrikopoulos S, Verchere CB. Islet amyloid: a long-recognized but underappreciated pathological feature of type 2 diabetes. Diabetes. 1999;48:241–253. - PubMed
    1. Martin JB. Molecular basis of the neurodegenerative disorders. N Engl J Med. 1999;340:1970–1980. - PubMed
    1. Selkoe DJ. Alzheimer's disease: genotypes, phenotypes, and treatments. Science. 1997;275:630–631. - PubMed
    1. Kayed R, Head E, Thompson JL, McIntire TM, Milton SC, et al. Common structure of soluble amyloid oligomers implies common mechanism of pathogenesis. Science. 2003;300:486–489. - PubMed